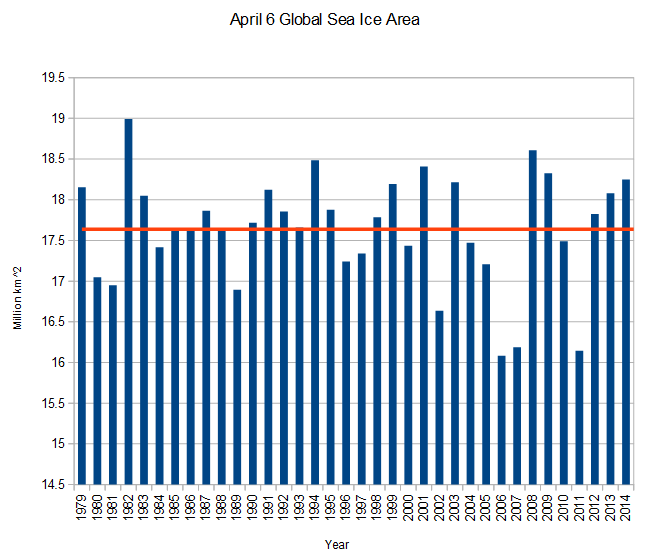
http://arctic.atmos.uiuc.edu/cryosphere/timeseries.global.anom.1979-2008
Disrupting the Borg is expensive and time consuming!
Google Search
-
Recent Posts
- Gaslighting 1924
- “Why Do You Resist?”
- Climate Attribution Model
- Fact Checking NASA
- Fact Checking Grok
- Fact Checking The New York Times
- New Visitech Features
- Ice-Free Arctic By 2014
- Debt-Free US Treasury Forecast
- Analyzing Big City Crime (Part 2)
- Analyzing Big City Crime
- UK Migration Caused By Global Warming
- Climate Attribution In Greece
- “Brown: ’50 days to save world'”
- The Catastrophic Influence of Bovine Methane Emissions on Extraterrestrial Climate Patterns
- Posting On X
- Seventeen Years Of Fun
- The Importance Of Good Tools
- Temperature Shifts At Blue Hill, MA
- CO2²
- Time Of Observation Bias
- Climate Scamming For Profit
- Climate Scamming For Profit
- Back To The Future
- “records going back to 1961”
Recent Comments
- Bob G on Gaslighting 1924
- Bob G on Gaslighting 1924
- Bob G on Gaslighting 1924
- conrad ziefle on Gaslighting 1924
- Bob G on Gaslighting 1924
- Bob G on Gaslighting 1924
- arn on Gaslighting 1924
- conrad ziefle on Gaslighting 1924
- Gordon Vigurs on Gaslighting 1924
- conrad ziefle on Gaslighting 1924


Reblogged this on The Grey Enigma.
Wow!! That’s crazy!!!
But, rowing season is near 😉
6th highest? Unless it is FIRST, it is due to global warming.
(Where did I put the sarc tag?)
What is the source of this data?
see the link below the graph, and yes, it is true. It is the only time in the record of three consecutive years in a row having above average global ice.
Check 1990 – 1992, are you a “warmist”, or do you just have difficulty with statistics?
A quick eyeball at the graph shown would seem to indicate that the average in 1990-1992 could have been high enough to discount those years. Don’t forget that the average will change with each new piece of data.
S.N.
Sorry I missed that. Thanks! Interisting data. I want to cite the source when I use this with my warmest associates.
Don’t the coolest warmists care?
This may sound silly at first…sea ice stats should be published at the equinoxes and solstices and the cross quarters in between …
There is science in the equinoxes and solstices and there is no science in our made up calendar which includes months named after roman emperors