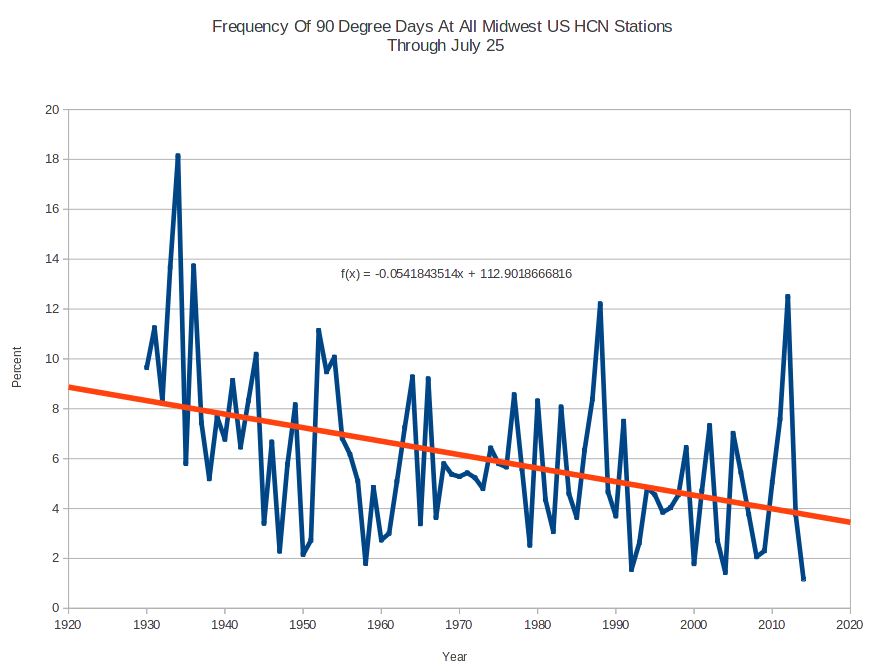
Ninety degree days in the US midwest occur less than half as often now as they did eighty years ago, with 2014 being the coolest summer on record. In 1934, hot days were eighteen times more common than this year. CO2 was 310 PPM at the time.
Disrupting the Borg is expensive and time consuming!
Google Search
-
Recent Posts
- Fact Checking NASA
- Fact Checking Grok
- Fact Checking The New York Times
- New Visitech Features
- Ice-Free Arctic By 2014
- Debt-Free US Treasury Forecast
- Analyzing Big City Crime (Part 2)
- Analyzing Big City Crime
- UK Migration Caused By Global Warming
- Climate Attribution In Greece
- “Brown: ’50 days to save world'”
- The Catastrophic Influence of Bovine Methane Emissions on Extraterrestrial Climate Patterns
- Posting On X
- Seventeen Years Of Fun
- The Importance Of Good Tools
- Temperature Shifts At Blue Hill, MA
- CO2²
- Time Of Observation Bias
- Climate Scamming For Profit
- Climate Scamming For Profit
- Back To The Future
- “records going back to 1961”
- Analyzing Rainfall At Asheville
- Historical Weather Analysis With Visitech
- “American Summers Are Starting to Feel Like Winter”
Recent Comments
- Ohio Cyclist on Fact Checking NASA
- Bob G on Fact Checking NASA
- Bob G on Fact Checking NASA
- Bob G on Fact Checking NASA
- Bob G on Fact Checking NASA
- arn on Fact Checking NASA
- Gordon Vigurs on Fact Checking NASA
- Bob G on Fact Checking NASA
- Bob G on Fact Checking NASA
- arn on Fact Checking NASA


That’s a nice but oddly specific stat. How about overall Midwest temperatures or winter/summer?
One glance at this chart and the whole notion of catastrophic warming goes up in smoke.
funny
I think you can safely say that the frequency of 90 degree days has dropped across the whole damn world. That’s it. It’s colder now than it was 80 years ago. No, we have not just suffered through eight decades of out of control hockey stick warming. What a load of garbage is this global warming baloney.
It’s been awesome for the corn crop here in the heart of the Corn Belt. The weather this year has been as near ideal as you can get. We still have not had a single day where the temperature exceeded 100 degrees, and until last week it had not exceeded 95. On top of that the rains have been near perfectly timed and in the ideal amounts. So the crop has experienced no heat stress. No water stress (either too much or too little). No pest stress. Ears are as long as your forearm and bigger around than a baseball bat. It’s going to be yet another record year for yields, at least here. I heard one guy half jokingly say that he worried global warming may put him out of business. Not because of adverse growing conditions caused by freaky weather, but the exact opposite. The near perfect growing season has caused corn prices to collapse as market participants anticipate record corn yields. He’s worried that if corn prices decline much further he may be unable to recover his production costs. It may or may not be accurate to blame global warming for the perfect growing season, but the predicament he faces is not hyperbole. Corn prices have declined from over $8.00 per bushel in recent years to under $4.00. It would be hard for anybody to adjust to a 50% reduction in income.
In other news, there is expected to be a record US soybean crop and massive corn crop.
“…thanks to benevolent weather this summer, with plenty of rain and moderate temperatures setting up the best growing conditions in years.
“Weather has been about as good as we have seen historically,” said Matthew Korn, analyst for Barclays, who researches fertilizer companies.”
Abundant Grain Ripples Through U.S. Farm Industry
http://online.wsj.com/articles/abundant-grain-ripples-through-u-s-farm-industry-1406505224
Where is the source of the chart above?? The global warming disciples will just say that chart above is made up….
It says right on the chart Midwest US HCN Stations
HCN = Historic Climate Network.
Steve Goddard put up his code a few months ago and the data is from the US government.
I saw the source being the Historic Climate Network…but that could have been made up. I was looking for more details on the reference website.
Gail, in response to your answer above, Now I get it. Thanks for your reply
Link is always right at the top of the page
http://stevengoddard.wordpress.com/ghcn-code/