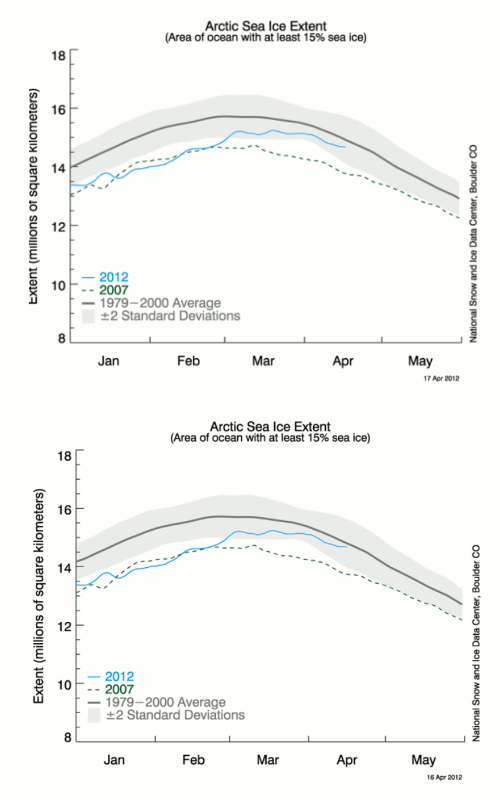
In 2012, I caught NSIDC cheating, just as Arctic sea ice extent was about to cross above the 1979-2000 average. They changed their measurement system using a completely bogus mathematical trick. NSIDC argued with me about it for a while, and eventually admitted that their nature trick was garbage.
NSIDC’s 2012 Nature Trick | Real Science
They have done a much bigger cheat this time, in order to generate this propaganda:
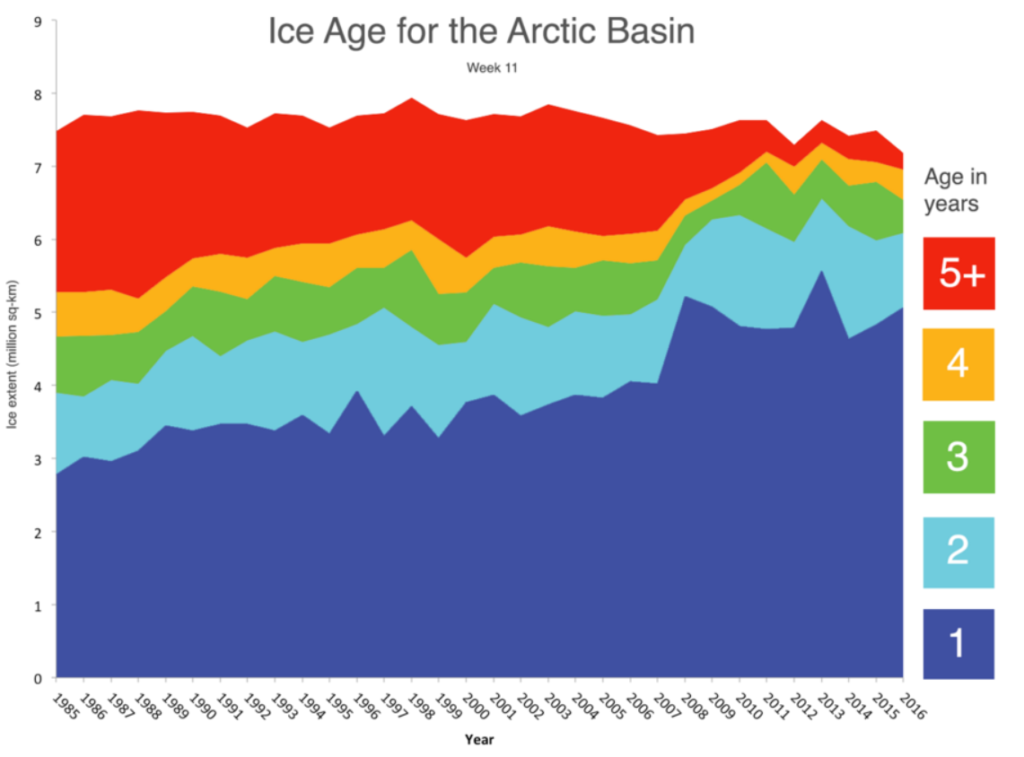
ice at least 5 years or older, is at its smallest level in the satellite record, representing only 3 percent of the total ice cover
March ends a most interesting winter | Arctic Sea Ice News and Analysis
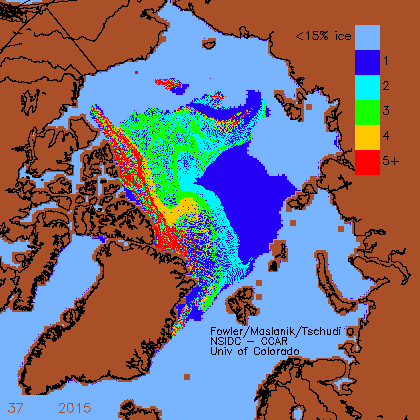
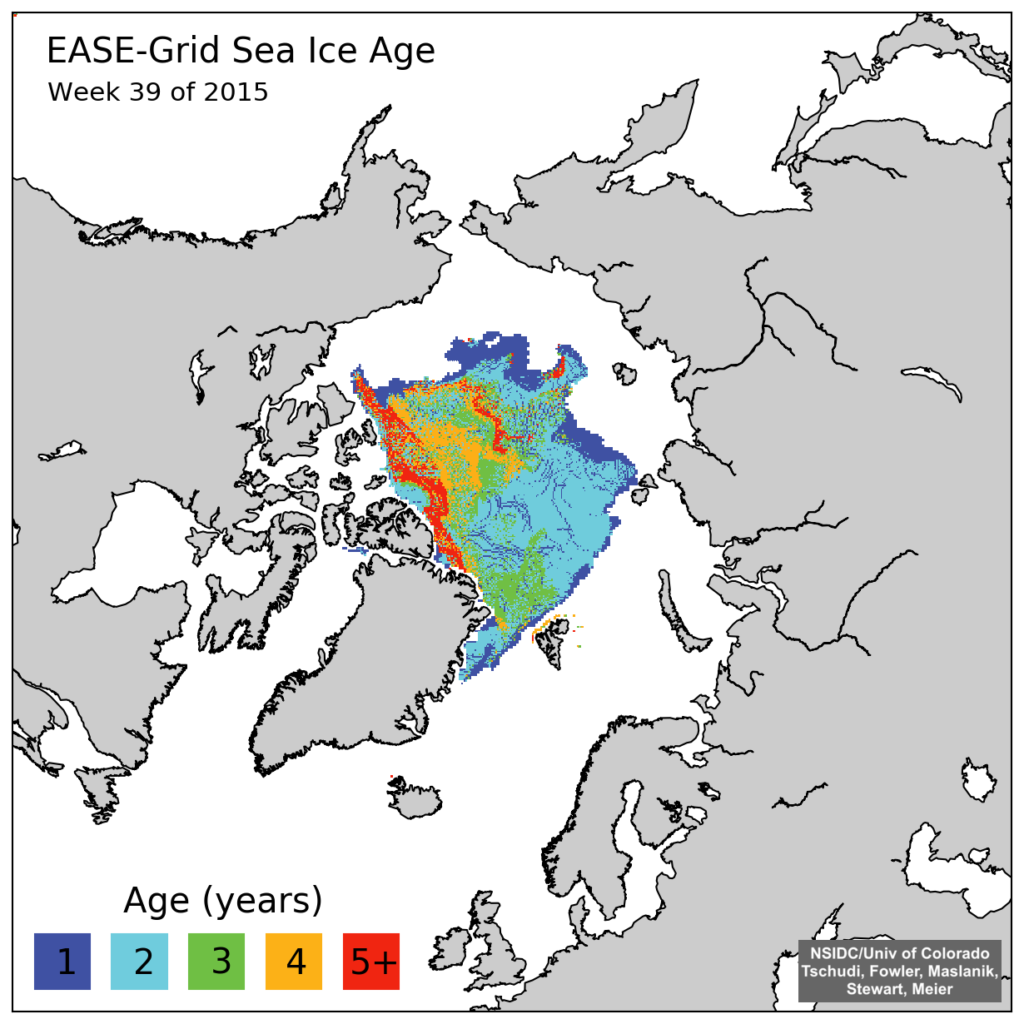
From week 1 1984 to week 37, 2015 NSIDC generated ice age maps in this format:
ftp://ccar.colorado.edu/pub/tschudi/iceage/gifs/
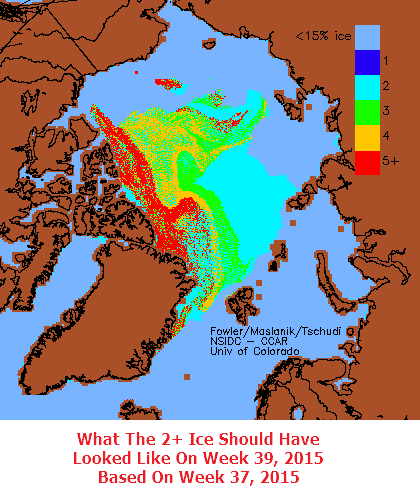
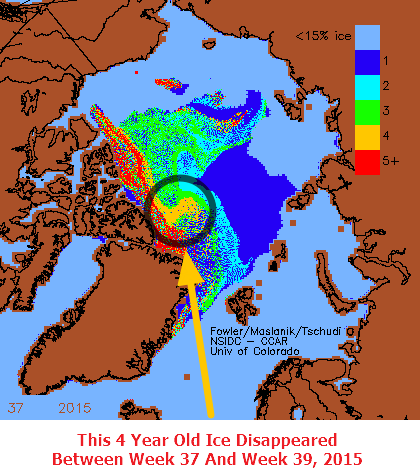
Week 38 (late September) is the week when the ice has its birthday, and all of the ice advances one year. I generated the map below of what week 38 should have looked like, based on advancing the ice age one year. There should have been a large increase in 5+ ice, because all of the 4 year old ice became five year old ice on week 38.
However, that didn’t happen. What they did was change to a new set of maps on week 39, and actually deleted the directory containing the 1984-2015 maps. They never generated a week 38 map. Very naughty.
iceage_browse_week_n_2015_39.png (1230×1230)
A large area of four year old ice not only didn’t age, but it disappeared entirely.
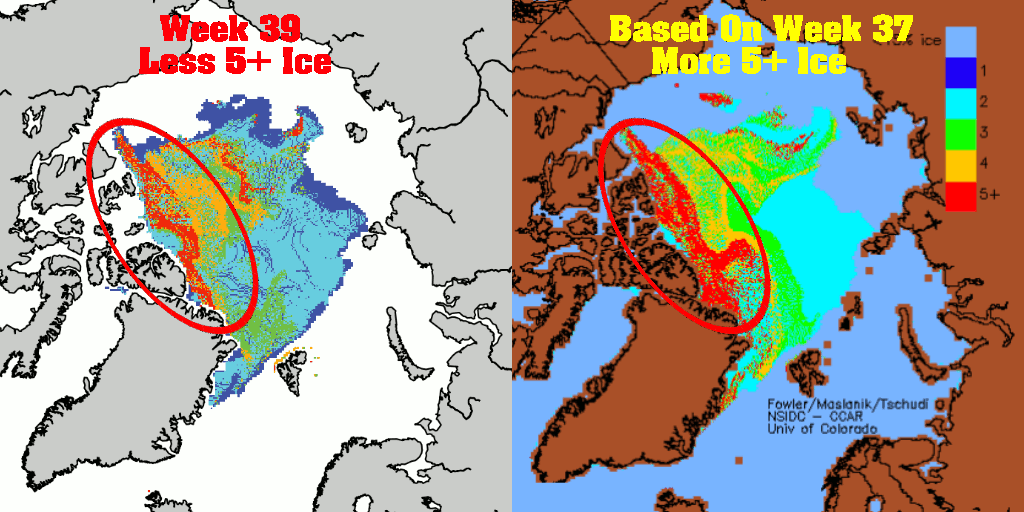
The animation below shows what the map should have looked like compared to what it does look like. They massively reduced the amount of five year old ice that should have been present in the map.
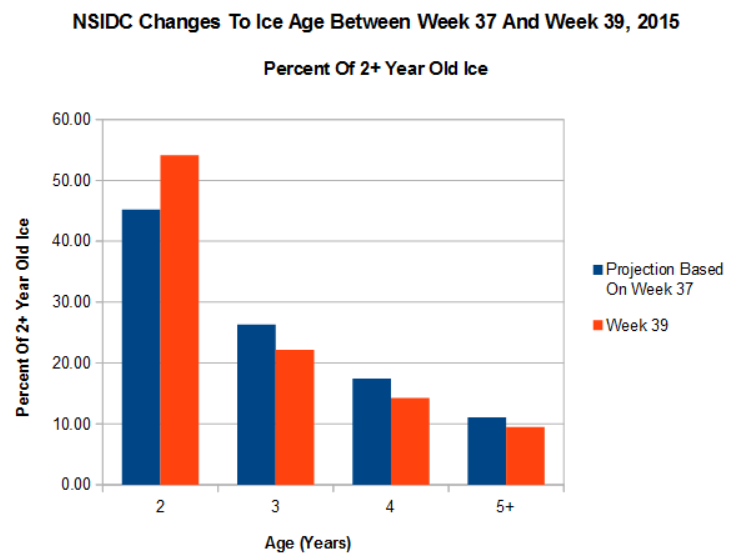
The graph below shows the sum total of they did. When they switched maps, they decreased the amount of 3, 4 and 5+ year old ice, and increased the amount of two year old ice.
Not only did they they alter the data, but they also deleted the evidence. And to make matters worse, they blocked auto archiving of the 1984-2015 data.
The data is not lost however. I have all their old maps archived here. Did they really think I wasn’t going to catch them?



Must be tough when all satellite and in situ data is saying the amount of ice is dwindling. I already see skeptics changing their old argument “it’s recovering” into “it’s supposed to be disappearing since this is teh holocene”, LOL
😀 😀
Fascinating watching alarmists wriggle and deflect when caught cheating and lying.
Still waiting for the massive recovery you’ve predicted for years…
If you are continue to lie and engage in dishonest discussion, you will be blocked. I don’t have any patience for people like you.
Steven, you have made an almost unbelievable discovery:
George Orwell was right when he predicted in “Nineteen Eighty-Four“ that government science would be used to deceive – rather than to inform – the public.
That empirical fact was, and still is, very difficult for us to accept.
@omanuel
Not only 1984
Eisenhower warned against it here.
Eisenhower’s Farewell Address to the Nation
January 17, 1961
…
Akin to, and largely responsible for the sweeping changes in our industrial-military posture, has been the technological revolution during recent decades.
In this revolution, research has become central, it also becomes more formalized, complex, and costly. A steadily increasing share is conducted for, by, or at the direction of, the Federal government.
Today, the solitary inventor, tinkering in his shop, has been overshadowed by task forces of scientists in laboratories and testing fields. In the same fashion, the free university, historically the fountainhead of free ideas and scientific discovery, has experienced a revolution in the conduct of research. Partly because of the huge costs involved, a government contract becomes virtually a substitute for intellectual curiosity. For every old blackboard there are now hundreds of new electronic computers.
The prospect of domination of the nation’s scholars by Federal employment, project allocations, and the power of money is ever present – and is gravely to be regarded.
Yet, in holding scientific research and discovery in respect, as we should, we must also be alert to the equal and opposite danger that public policy could itself become the captive of a scientific-technological elite.
…
http://mcadams.posc.mu.edu/ike.htm
cfool’s ignorance continues to shine with a puking green glow.
It is easier to fool the people than to convince them they’ve been fooled.
~ Mark Twain
I think it is pretty damning when they block access to archived pages in an attempt to hide the lie. That in itself is proof of some skulduggery on their part. And I am sure loss of the one satellite that had been used for these purposes, plays right into their hands. If and when a new satellite is ever tasked, I am sure its results will be ‘adjusted’ to match the false narrative.
Oh it’s a global conspiracy again involving all scientists and all space agencies? Steer clear of that medicinal crack you’ve been smoking, it’s not doing you any good…
You are just about done here.
Do it. I am sick of ‘balanced debate’ ala Fox News. I don’t want to hear or read any longer Algore, SanFranNan, Hussein, et al puking on America. Let’s just see the truth on this site as a refreshing change.
Troll talks about smoking crack and that isn’t enough to ban him? He isn’t debating, he’s trolling.
Oh it’s a global conspiracy again involving all scientists and all space agencies?
Nope, 31,000 working scientists say CAGW is BS. Conspiracies do not involve the entire globe, they are cobbled together by a few elites, and sold to the population at large.
You really are ignorant of the world around you.
Reblogged this on Canadian Climate Guy.
The question is who issues cdqgfj his/her paycheck? Whoever is buttering his/her bread will be the telltale of why being nasty has to obfuscate having a fact based discussion.
Reblogged this on Climate Collections.
Steve,
Rather than going on about the pretty maps and the weeks what is your reply to the chart
http://realclimatescience.com/wp-content/uploads/2016/04/2016-04-22061634.png
This seems to show massive loss in old ice around the 2007 summer when there was the big melt. You claimed it was due to before then with winds.
How does that chart back up your claim?
Andy
Andy, you ask, “what is your reply to the chart?”
Did you actually read Tony’s post?
Do you want me to post the entire blog post in the comment section?
Reports of Arctic Ice demise are greatly exaggerated.
https://rclutz.wordpress.com/2016/04/22/premature-reports-of-ice-death/
here’s your claim again
“From about 1988 to 2007, the Arctic lost large amounts of multi-year sea ice (MYI) due to winter winds blowing it out into the North Atlantic. That pattern has since reversed, and as you can see below, older and thicker ice is moving away from the Atlantic and into the Beaufort Sea, and becoming older and thicker.”
[SG : The chart shows exactly what I am saying. You are attempting to change the subject. I can’t imagine why. LOL]
It doesn’t seem to match
You had a terrible time with the Arctic in 2016. First you claimed it was going to be just like 2006 again for the summer minima. It wasn’t, it was a lot lower.
Then you claimed it was the shortest melt season ever after reading the DMI graphs wrong. It wasn’t.
Then that same DMI graph was obviously faulty and yet you kept using it to show rapid ice extent gain even though no other graphs, including DMI ones, showed it. I pointed it out here countless times, nobody wanted to listen.
You’ve got a really poor Arctic track record to be honest so surprised you can find NSIDC to be cheating. They might be, but I doubt it. Only the followers will believe.
Go back to the old days when you posted some good stuff on both poles. Before you got too annoyed by the alarmists.
Andy
https://climatedenierdotme.files.wordpress.com/2014/12/b4bw0yiciaapjqb.png
http://pbs.twimg.com/media/CSu4joPUYAAPObc.png
http://pbs.twimg.com/media/CQeKQGJVAAAOGtB.jpg
http://pbs.twimg.com/media/CQI8NHjUYAAOQEC.png
Tomorrow the central Europe will flow arctic air. You may experience snowfall. At night frost.
Bingo, had rsin and snow at the same time here in helsinki 2 hrs ago, where is global warming when you need it lol, hottest march ever my cold a$$ behind
Global sea ice from JAXA
INSIGNIFICANTLY DIFFERENT FROM AVERAGE.
https://sunshinehours.files.wordpress.com/2016/04/jaxa-global-ice-extent-as-of-2016-112.png
And a bit OT , but Josh nails it yet again !!
https://sunshinehours.files.wordpress.com/2016/04/902844-26987555-thumbnail.jpg
And the full story
https://www.wind-watch.org/documents/subsidy-sam-the-turbine/
Arctic sea ice from Jaxa.. I bit low… but
INSIGNIFICANT CHANGE FROM SHORT TERM AVERAGE.
(certainly way higher than most of the last 10,000 years)
https://sunshinehours.files.wordpress.com/2016/04/jaxa-arctic-ice-extent-as-of-2016-112.png
JAXA sats are 10% uncertain, iffy on egde areas and not good when measuring thickness when there is any meltwater on the surface, it’s on their own website, 10% and the other issues leave the door open to “mishaps” with data
All satellites have their problems. JAXA is the best we have right now and it’s looking like that may be the case for awhile.
As I said.. INSIGNIFICANT CHANGES. !!
Probably pretty much IMMEASURABLE changes, as well.
650,000 km^2 lower than the 2000s average for the date. That’s bigger than the surface area of France. ‘Insignificant’?
from Chris71 on the new site
hmm… looks like they already made a gif for week 41-2015 which showed accurate 5+year sea ice before they changed their set of maps. I just found it archived here:
http://www.arctic-charts.net/ccar.colorado.edu/pub/tschudi/iceage/gifs/latest.gif
I created snapshot from the full page at https://archive.is/TmKO2
A brilliant find , that proves SG is correct.
cFool and green fiends.. apology required.
What is really interesting is that 1 year sea ice seems to have formed since week 38 change-over point.
OOPS forget the quote marks.. The first line and the last two lines are mine… the rest is a direct copy for Chris’s post.
Reblogged this on Climatism and commented:
Another example of why scientific organisations have – tragically – become almost the last places to hear the truth about climate change. Too many reputations are now at stake. And the funds must keep rolling in regardless of the ‘scientific’ truth.
This ongoing data fraud by ‘trusted’ government institutions corrupts our understanding of how the climate really works, therefore is a crime to science, and humanity.
Reblogged this on Roald J. Larsen and commented:
This is important to spread – The man made global warming fraud has to be stopped and those responsible should be prosecuted in the court of law!
This has nothing to do with science, this is nothing short of fraud!
Pingback: Icegate: Now NSIDC Caught Tampering With Climate Records - Conservative News & Right Wing News | Gun Laws & Rights News Site : Conservative News & Right Wing News | Gun Laws & Rights News Site
Pingback: Icegate: Now NSIDC Caught Tampering With Climate Records | The BS Junction
Reblogged this on 4timesayear's Blog.
Pingback: Icegate: Now NSIDC Caught Tampering With Climate Records | The Invisible Opportunity: Hidden Truths Revealed
Pingback: Icegate: Now NSIDC caught tampering with climate records | Follow The Money
Pingback: Icegate: Now NSIDC Caught Tampering With Climate Records