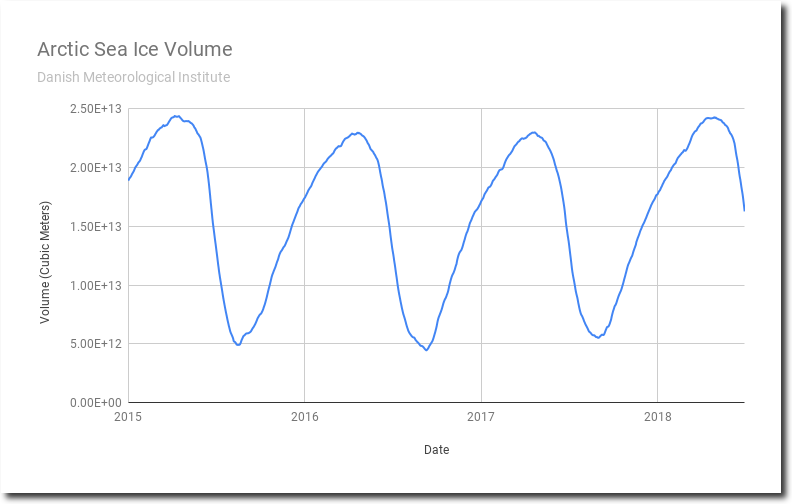
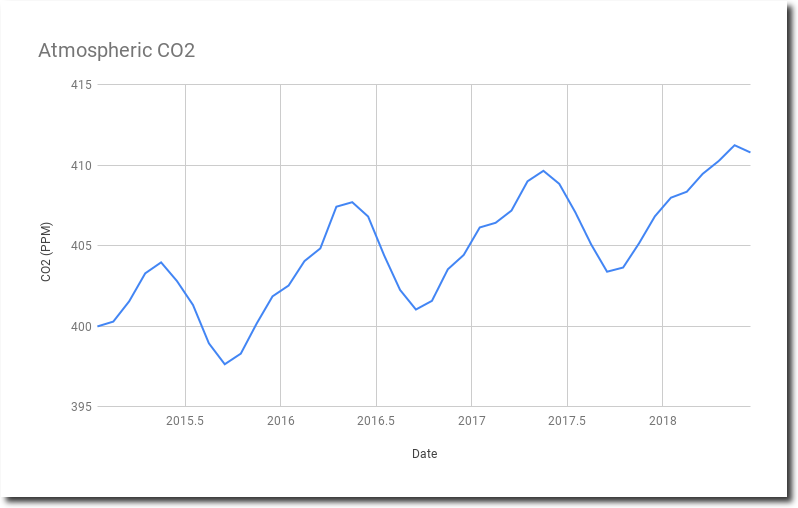
Comparing Arctic sea ice volume to atmospheric CO2, it is clear that peaks in CO2 correspond with peaks in Arctic sea ice – and vice-versa.
What this shows us is that temperature drives CO2. Most of the world’s oceans are in the southern hemisphere. During the southern hemisphere summer, the oceans warm up and outgas CO2. During southern hemisphere winters, the oceans cool and absorb CO2.
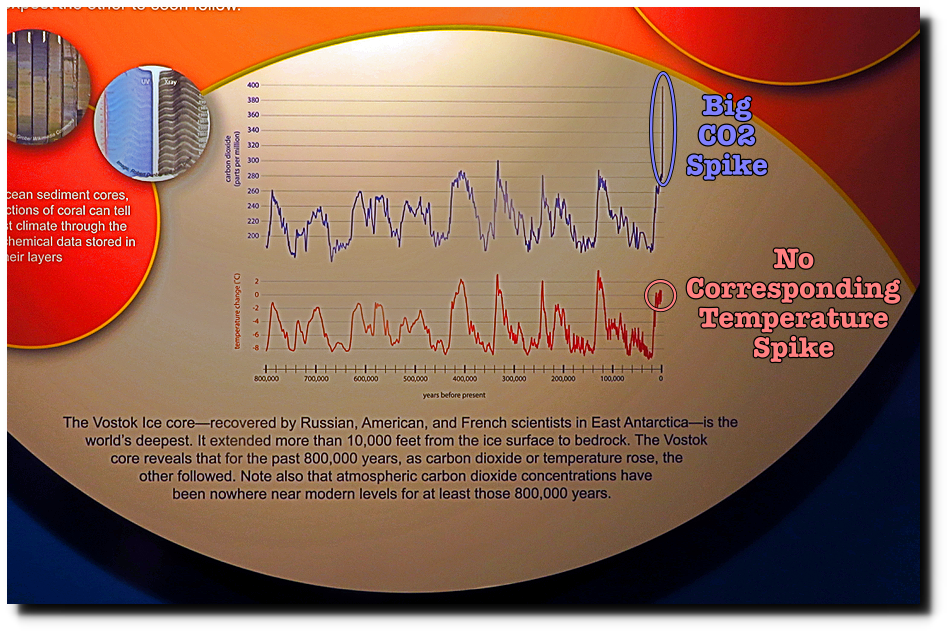
The graph of Antarctic ice core data below is on display at the NCAR museum. It shows how CO2 and temperature correlate, for the reasons I just explained. It also shows that the recent spike in CO2 has had no corresponding increase in temperature.
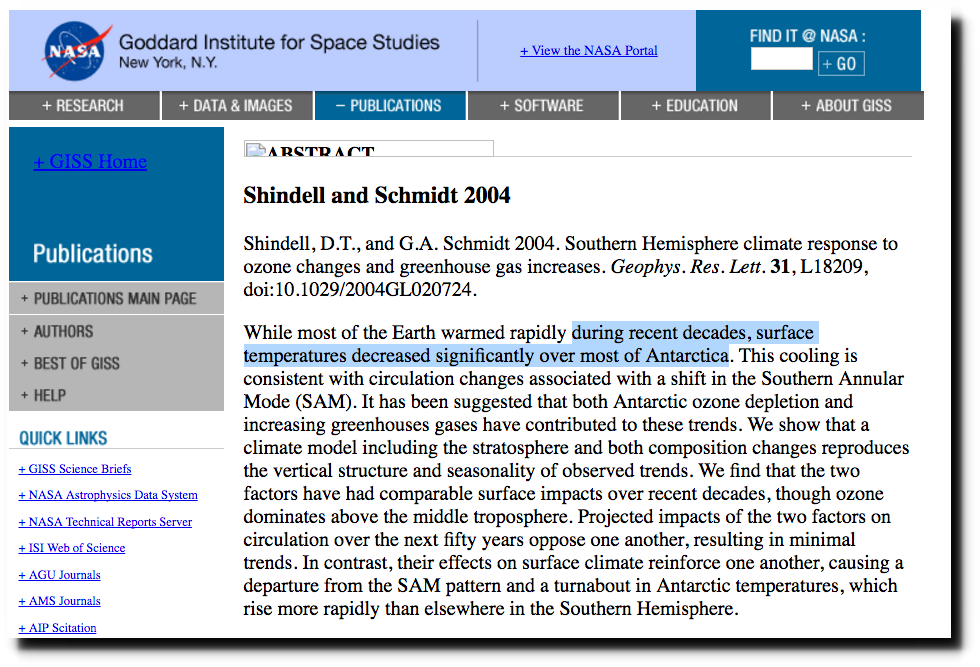
Climate science is based on putting the cart before the horse. Temperature drives CO2, not the other way around. In fact, Antarctica has cooled as CO2 has increased.
Pubs.GISS: Abstract of Shindell and Schmidt 2004
Climate alarmism depends on putting the cart before the horse and misleading the public about this topic. This deception is essential for maintaining the climate scam, and was so important that Al Gore and Laurie David actually reversed the scale of the X-Axis in order to defraud children in her school textbook.
Her fraudulent graph made CO2 change before temperature, instead of the actual relationship – which is the exact opposite.


