
If the present refuses to get warmer, then the past must become cooler
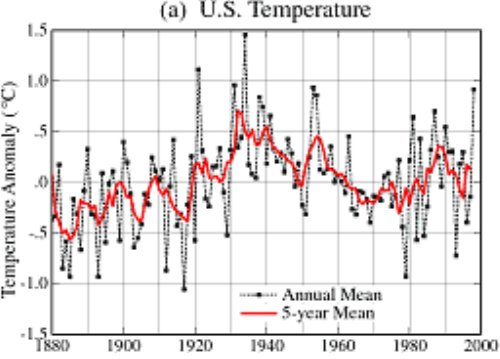
As of 1999, NASA showed that US temperatures peaked in the 1930s, and had been declining sharply ever since. Note that 1934 was more than half a degree warmer than 1998 in the 1999 GISS graph below.
Whither U.S. Climate?
By James Hansen, Reto Ruedy, Jay Glascoe and Makiko Sato — August 1999
Empirical evidence does not lend much support to the notion that climate is headed precipitately toward more extreme heat and drought. The drought of 1999 covered a smaller area than the 1988 drought, when the Mississippi almost dried up. And 1988 was a temporary inconvenience as compared with repeated droughts during the 1930s “Dust Bowl” that caused an exodus from the prairies, as chronicled in Steinbeck’s Grapes of Wrath.
in the U.S. there has been little temperature change in the past 50 years, the time of rapidly increasing greenhouse gases — in fact, there was a slight cooling throughout much of the country (Figure 2).
NOAA and CRU also reported no warming in the US, during the century prior to 1989.
February 04, 1989
Last week, scientists from the United States Commerce Department’s National Oceanic and Atmospheric Administration said that a study of temperature readings for the contiguous 48 states over the last century showed there had been no significant change in average temperature over that period. Dr. (Phil) Jones said in a telephone interview today that his own results for the 48 states agreed with those findings.
But that just wasn’t going to do, so they started tampering with the US temperature data. With each successive version they cool the past further, and warm later temperatures further. They now show 1998 0.1ºC warmer than 1934, compared to 0.25ºC cooler in the 2000 version, and more than 0.5C cooler in the 1999 version (top image above.)
The graph below shows how the slope has steadily increased in the 2000, 2001, 2012 and 2013 versions of the same 1930-1999 data. 
2000 version : www.john-daly.com/usatemps.006
2001 version : www.giss.nasa.gov/data/update/gistemp/graphs/FigD.txt
2012 Version : data.giss.nasa.gov/gistemp/graphs_v3/Fig.D.txt
2013 version : ata.giss.nasa.gov/gistemp/graphs_v3/Fig.D.txt
Current version : Fig.D.gif (525×438)
1999 version : fig1x.gif (500×182)

US warming truly is man-made.
Nicely summarized! It could be Exhibit-A at the trial of James Hansen for crimes against Science. Too bad he will probably assume room temperature before that day would ever come.
“To Tell the Truth” (21st century version)
Will the real temperature data please stand down.
How do you get the older versions, the wayback archive only gives me back to 2012. I must be missing something.
Note that the path to the file changed in 2012
Thanks for replying…I see.
Re NOAA temperature tampering
I have often doubted their temperature maps that always seem to indicate we are much above average most of the time. I have been grain farming for 40 years.
See : wxmaps.org
Man made lying basis for Global Warming . Environmental alarmists with Leftist Agenda and Globalist ideology seeking to control the individual and amount of Carbon one exhales everyday and will eventually seek to tax and control that. This is Totalitarism in full display with this fraud of a science and movement ..