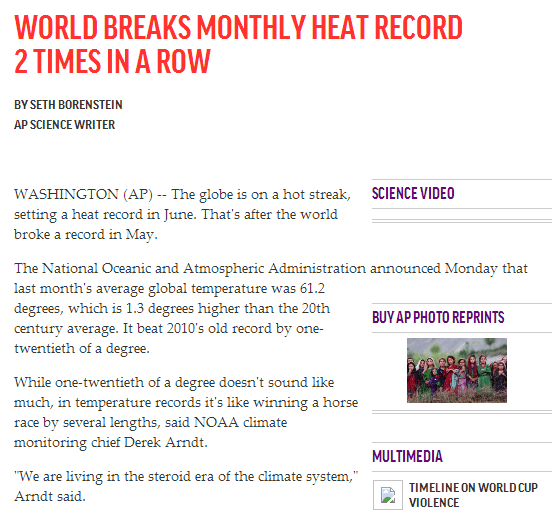
NOAA has entered the realm of blatant, unabashed fraud in their current discussions about climate.
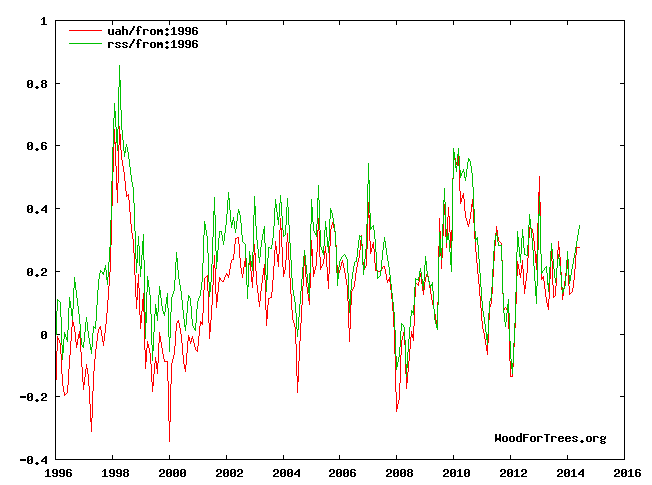
More accurate satellite data which actually measures troposphere temperatures, shows that NOAA’s claims of record heat are incorrect. NOAA’s failure to disclose this information in their press release shows that they are intentionally misleading the public.


At least not in Barcelona. We had some warm days but not a real summer .
From what I’ve seen (felt) it’s been cold all along the west coast of Europe for most of the year. Which means that the North Atlantic is cold, since these are maritime climates with the prevailing winds coming in from the west. (So the claims about SST hotting have to be nonsense as well.)
It’s certainly been hotter inland, but nothing spectacular as far as I know.
No one can tell us where these heat records are coming from because it’s colder than usual in North America, Europe, Australia and Arctic and Antarctica. It must be real hot in China, Africa and South America right now.
I carefully checked US June temperatures and a great majority of the country was barely above normal. I don’t think last June would rank in the top 25. Meanwhile record cold in July with many places in the Midwest and upper South 5-7 degrees below normal.
There is going to be a 2-3 day warm spell this week followed by more near record to record cold for the rest of the month. I believe a lot of “coldest July on records” are going to fall.
It is amazing how global warming seems to be bypassing the US, the source of all evil/greed and is only hitting the remote parts of the world. Very strange.
There’s a scam going on right now between Japanese Meteorological Agency and NOAA. They have designed it so this will be the hottest year on record and they use each other for confirmation bias.
Interesting.
How can I source that?
Look up press releases for both and look at how they support each others findings. Then look at satellite records and all other records and how no one else is showing what they’re showing.
That is incredibly weak evidence.
OK
Could you show this graph with an average trend line superimposed?
It’s going slightly up if you consider since 1996,
http://www.woodfortrees.org/plot/rss/from:1996/to:2015/plot/rss/from:1996/to:2015/trend
but it’s going down if you consider since 2001,
http://www.woodfortrees.org/plot/rss/from:2001/to:2015/plot/rss/from:2001/to:2015/trend
I think the 2nd is a better estimate because it starts when the great ENSO of 1997-2001 ended, and a step change in the world’s climate trend happened.
thank you
You’re welcome, “woodfortrees.org” is an important site for the climate discussion.
jlc. Believe it or not, the warmies consider WfT ‘sceptics’ and their graphs are not accurate, which is why whenever I quote trends I use SkS’s own trend calculator;
http://www.skepticalscience.com/trend.php
Of course there is NO DIFFERENCE between the two as they BOTH use the SAME DATA!
Anyways….Using SkS’s own trend calculator, there has been ZERO warming so far this century (Jan 1st, 2001). That is 14 years and 6 months.
(June 2014)
GISTEMP – Trend: 0.022 ±0.157 °C/decade
NOAA – Trend: -0.003 ±0.145 °C/decade
HADCRUT4 – Trend: -0.009 ±0.141 °C/decade
BEST – Trend: 0.064 ±0.384 °C/decade
NOAA (land only) – Trend: 0.063 ±0.264 °C/decade
RSS – Trend: -0.060 ±0.252 °C/decade
UAH – Trend: 0.054 ±0.252 °C/decade
The press will run the “hottest ever” headline. End of story.
NOAA’s failure to disclose this information in their press release shows that they are intentionally misleading the public.
On orders from high up in the administration; what can you do?
Who is this Seth Borenstein character? Hasn’t he been the lead disinformatinalist on this subject for awhile now too?
Claims to the “AP Science Writer” too.
.
We can use their graphs and data, but cannot listen to their comments.
Good for us their own data show how wrong their comments are, their NINO-3-4 graph shows the present positive oscillation, which didn’t make the “El Nino episode” level, as having shorter duration and smaller amplitude than the one in 2012
http://stateoftheocean.osmc.noaa.gov/sur/images/nino34_short.gif
as expected in a period of world cooling, as we are now.
More: their Oceanic Nino Index (ONI)
http://www.cpc.ncep.noaa.gov/products/analysis_monitoring/ensostuff/ensoyears.shtml
shows that the present period without El Nino’s is already the longest since their records began in 1950, because it’s not possible anymore to have an El Nino until their update for the JJA period (3 months centered in July). Therefore, since April 2010 we already have more than 4 years + 2 months of negative or neutral ENSO, which is the longest period in their records.
Again showing a cooling trend, no matter what they “say”.
Still searching for data for their conclusion, now they have to create it.
Spoiler alert: Massive irregular heatwaves all across the globe where there are no actual people.
I smell BS
“Our algorithm is working as designed”
Are the satellite and raw thermometer data sets in reasonable agreement? That would serve as a convincing argument to the casual non-believer. As for the CAGW religious cult, no need to bother.
Interesting. Have wondered if reported sat measurements have differed over time?
Read this piece… Seems they justify “Hottest Ever” by including ocean readings and of course “adjusted data”…
Nobody believes this crap yet they double down on hysterical predictions and lies…
http://www.huffingtonpost.com/2014/07/21/hottest-june_n_5606284.html
Someone needs to place a phone call to Thomas Karl and interview him on this …
Karl is director of the National Oceanic and Atmospheric Administration’s National Climatic Data Center.
http://en.wikipedia.org/wiki/Thomas_R._Karl
http://en.wikipedia.org/wiki/National_Climatic_Data_Center
NCDC – For Media Requests – Katy Vincent
Email: [email protected]
From Google:
Address: 151 Patton Ave, Asheville, NC 28801
Phone:(828) 271-4800
Hours: Open today · 8:00 am – 6:00 pm
.
Maybe the WJR (Detroit) radio host who interviewed Tony could give Karl a call …
.
Tom Karl promoted a nonexistent PhD on his bio page. Of course it was taken down after he was outed.
Zeke and Mosher tell us that averaging absolute temperatures are useless, only temperature anomalies are scientifically defensible. Then we have NOAA giving us the last months average global temperature (61.2) to one decimal place. Wonder what the true error bars are on this one?
Desperation is setting in. Expect these tactics to intensify. These clowns will lie there way to hell to get what they want.
The real issue is today’s journalists are not that smart. They lack critical thinking skills and are all in the same social circles. So you have “SETH BORENSTEIN, AP SCIENCE WRITER” who looks for stories that support his bias, rather than being a writer about science.
The real issue is today’s journalists are not permitted to think.
And there are 11 million illegals in the US. Lies, lies all the .gov does is lie.
“NOAA Breaks Their Dishonesty Record Two Months In A Row”
Anyone doubt they will try for three-in-a-row?
Second month in a row that NOAA NCDC staff have maxed out their global warming bonuses.
The drinks are on them!
They must be using the Hockey Stick Graph program–built on lies it produces lies. Time to call those two Canadians M&M who so irritated those climate scientists a decade ago.
“We are living in the Steroid era of the climate system”
– oh good god. Over 1/20 of a degree. And they wonder why we laugh when they call themselves “scientists”.
It beat 2010’s old record by one-twentieth of a degree.
While one-twentieth of a degree doesn’t sound like much, in temperature records it’s like winning a horse race by several lengths, said NOAA climate monitoring chief Derek Arndt.
This would be funny, if it weren’t so sad.
They also allege in the article that the oceans are at an all time record.
And that’s only part of it. The world’s oceans not only broke a monthly heat record at 62.7 degrees, but it was the hottest the oceans have been on record no matter what the month, Arndt said.
Desperate people do desperate things.
Isn’t 1/20th of a degree well within the margin of error?
There are no errors in climate science. Only “The Data Formerly Known as Accurate”
The administration is pushing this EPA reg they have been sitting on for 4 years and NOAA is under orders. They had thought that this years el nino would bake the globe but that fizzled so now they are reduced to outright lying.
This is a horse race with drugged horses and one lame old gray mare who ain’t what she used to be.
See? And they all beat Secretariat and Sea Biscuit!
Robert Austin says:
July 21, 2014 at 8:16 pm
‘Zeke and Mosher tell us that averaging absolute temperatures are useless, only temperature anomalies are scientifically defensible.”
Mosher also says that if you average all of the GCM outputs you get a better result?????
Certainly. If you take a hot-off-the-grill hot-dog, & mix it with 30 hot-off-the-grill dog turds, it makes it so much better.
The writer is taking numbers from a chart that only measures land temperatures, not global temperatures. Look at this chart from the same interactive website that Steven Goddard uses to “prove” NOAA is lying about their records. I simply changed the settings from “land” to “global” and went back to 1930 with it. It shows a steady rise in overall temperatures over the last 80 years.
http://www.woodfortrees.org/plot/hadcrut4nh/from:1932/plot/gistemp-dts/from:1932
1/20 of a degree out of 288.65 Kelvin is like winning a horse race of 1 1/4 miles by 13.7 inches.
A horse in Derek Arndt’s world must be 4 inches long.
There will be a change in attitude after November. More than a few of us want reparations and refunds for the money we squandered on phony research from corrupt researchers. In lieu of them we will demand well deserved prison terms. I am so looking forward to that outcome.
Im no scientist but it was a very cold winter a cold spring and so far a cool summer here in the northeast. I dont think we’ve reached 90 yet this summer.
Don’t forget these geniuses have to explain how the surface can warm faster than the troposphere. It’s an upside down greenhouse effect.
Neither NRL maps of Antarctic and south Atlantic Ocean nor BOM Indian Ocean Dipole charts agree with the two big Southern Hemisphere hot spots on the NOAA global anomaly map. Both show SST’s as very cold. NOAA is making it up. Bloody disgraceful whether intentional or incompetent.
Links:
http://www.bom.gov.au/climate/enso/#tabs=Indian-Ocean
http://www7320.nrlssc.navy.mil/GLBhycom1-12/navo/antarcsstnowcast.gif
Reblogged this on Sierra Foothill Commentary and commented:
NOAA is desperate to support President Obama’s claim that the planet is warming, yet the Satellite data which has many more data points, does not show the NOAA warming. Who are you going to believe, the government or independent analysis of the satellite data? You decide
The supposed record events appear associated high sea surface temperatures,influenced by El Niño conditions, possibly have measurement bias errors associated with variable sea ice extent, and have a context within the modulated gradual long term sea temperature increase through the interglacial.
I note that this year between May and June, the global sea ice extent was about 1 million sq kilometre above the 1979-2008 average.
Doesn’t this suggest that the heat loss, from the oceans to the atmosphere, occurs across an ocean area which is reduced by about 0.3% from the average- and that consequently there is a virtual sea surface temperature increase associated with that increased average heat transfer per unit area of ocean?
Moreover, at this time of year, the change in ice extent masks (for SST measurement of the Arctic and the Antarctic) increases the area (from the average) of Arctic areas that are presently warmer than the average, and reduces the areas of the Antarctic that are presently cooler that the average.