
More spectacular fraud and data tampering from the sea level people at the University of Colorado.
Last year they showed that large areas of the Pacific were experiencing 3 mm/year declines in sea level since 1993.
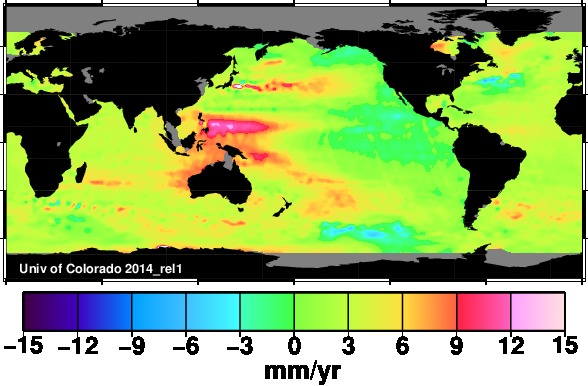
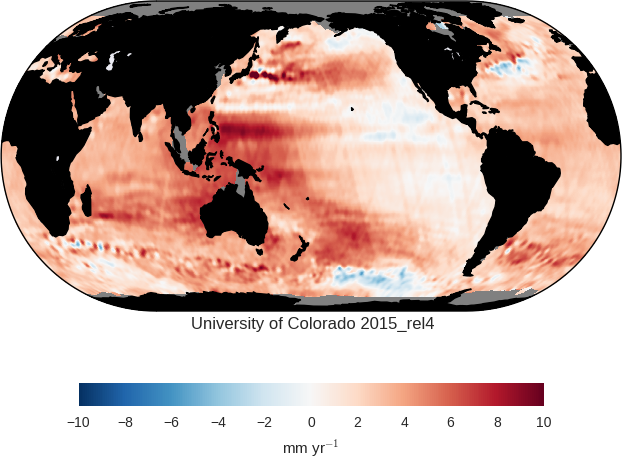
They have since erased this, and painted their map red. The only way this could have happened, is if sea level rose 63 mm (21 years * 3 mm/year) this year.
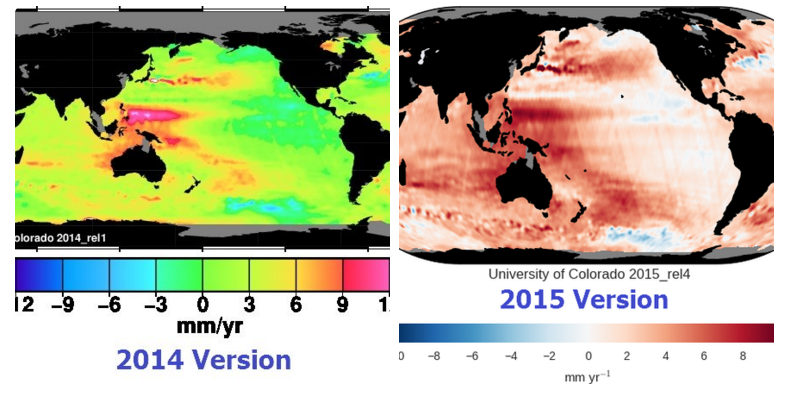
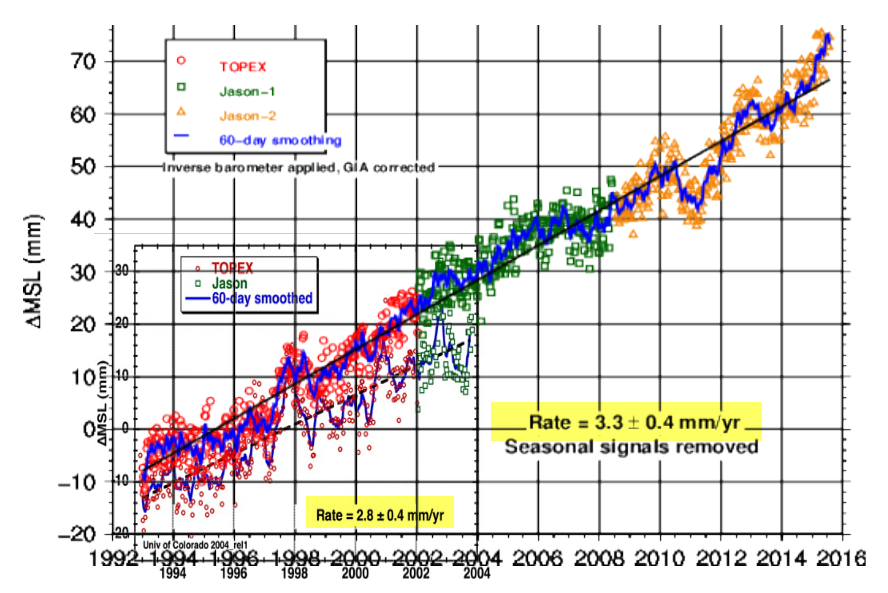
The side by side view is most impressive
In 2004, they showed 2.8 mm/year sea level rise
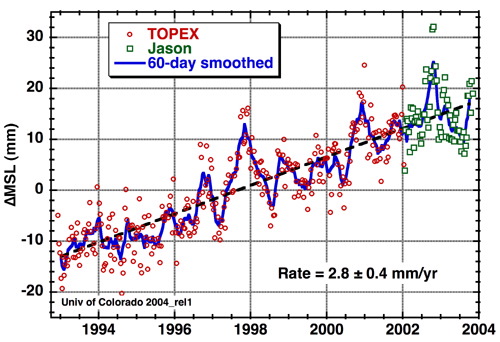
They have since inflated that to 3.3 mm/year
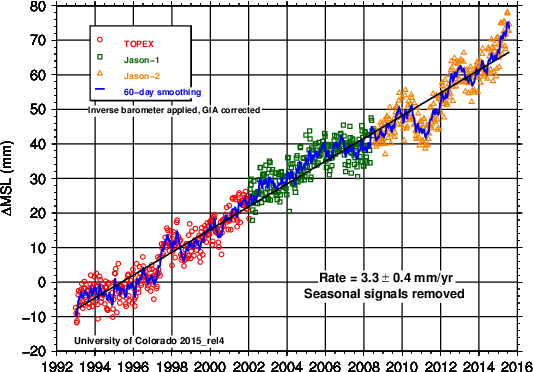
The next image overlays the two graphs. Note that they have altered their trend outside their own reported error of 0.4 mm/yr
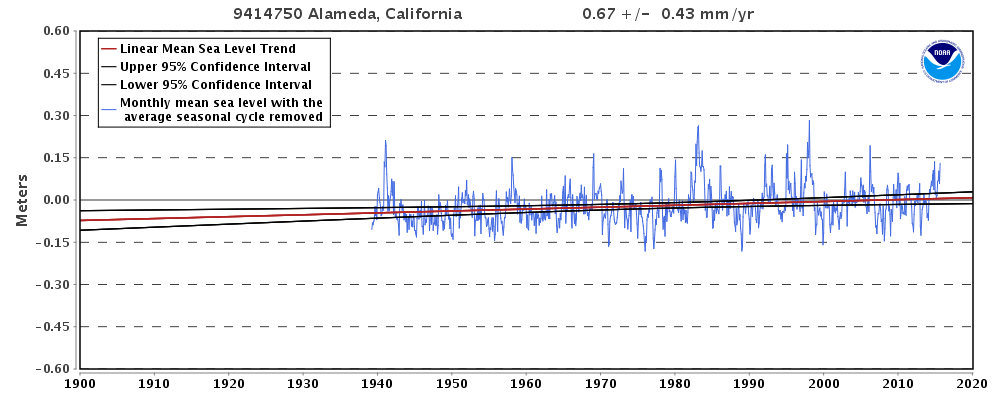
But the University of Colorado fraud is much worse than it seems. They are reporting almost twice as much sea level rise as NOAA
absolute global sea level rise is believed to be 1.7-1.8 millimeters/year.

Like with all other claims from climate alarmists, the increase in sea level rise rates after 1993 is completely fraudulent. It simply didn’t happen.

It seems to me that sooner or later their bubble will have to burst and they will have to answer for it. BTW, what person would be the main driver of this fraud at U of C?
Don’t know. There are so many climate fraudsters here in Boulder, it is hard to keep track of them all.
R. Steve Nerem and Dallas.Masters
RAH do not forget all the connections I dug out on Judith Curry and her partner Peter Webster
https://stevengoddard.wordpress.com/2015/02/10/the-global-temperature-record-is-meaningless-garbage/#comment-489761
https://stevengoddard.wordpress.com/2015/02/10/the-global-temperature-record-is-meaningless-garbage/#comment-489803
Webster is a member of the Aspen Global Change Institute
http://www.agci.org/images/earth"e.jpg
T h e A s p e n G l o b a l Wa r m i n g A l l i a n c e
The City of Aspen, Community Office of Resource Efficiency, AGCI, The Aspen Institute, Aspen Skiing Company, Rocky Mountain Climate Organization, New Century Transportation Foundation, Holy Cross Energy, Rocky Mountain Institute, Aspen Center for Environmental Studies, Susan Joy Hassol, and Climate Mitigation Services.
AGCI = Aspen Global Change Institute:
An ally is The Aspen Institute
****FUNDING for Aspen Global Change Institute :
The National Aeronautics and Space Administration (NASA)
The National Oceanic and Atmospheric Administration (NOAA)
The National Science Foundation (NSF)
The Department of Energy (DOE)
The William and Flora Hewlett Foundation
The David and Lucile Packard Foundation
Analysis, Integration, and Modeling of the Earth System (AIMES) / International Geosphere-Biosphere Programme (IGBP)
When you pull the Aspen Global Change Institute thread things get real interesting…
And guess who is on the staff of Climate Communication?
>>>>>>>>>>>>>
Peter Gleick
Katharine Hayhoe
Michael Mann
Jeff Masters
Michael Oppenheimer
Naomi Oreskes
Jonathan Overpeck
Benjamin Santer
Kevin Trenbreth
Don Wuebbles
To name just a few.
A bit more on the Dynamic Duo of Webster and Curry
We may be making progress on ResearchGate, as the conversation moves to population control.
https://www.researchgate.net/post/Is_there_convincing_evidence_of_AGW
What is ‘Jason’ ?
Jason-1 and 2 were satellites that measured sea level. Topex is another one. They used to include data from the Envisat satellite, but it didn’t show enough sea level rise and was excluded
Thank you.
Here’s another way of looking at it:
http://oi59.tinypic.com/24e8482.jpg
That graph is getting to be over a year old now, I should re-do it.
Satellite measurement U of Colorado (mm/yr):
Global: 1992-2003 3.23 2004-Feb 2015 2.71
Pacific: ” ” 3.23 ” ” 2.34
Atlantic: ” ” 3.51 ” ” 2.12
Two days ago I found this data on line showing the decreased rate of SLR & I retyped it as shown for a comment. Today I cannot find the citation or link. I’m almost positive I found it on Freinds of Science.
Here’s a presentation by Dr. R. Steve Nerem
“Why has an acceleration of sea level rise not
been observed during the altimeter era?”
R. Steven Nerem (University of Colorado)
Here’s the link:
http://www.aviso.altimetry.fr/fileadmin/documents/OSTST/2011/oral/02_Thursday/Splinter%203%20SCI/04%20Nerem%20ostst_2011_nerem.pdf
Scroll to the last page where you find that the acceleration rate of sea level rise is negative at minus -0.06 mm/yr² And currently it’s still negative.
It’s rather easy to determine that there’s been a good deal of inflating the rate of sea level rise by CU Sea Level Research Group scientists. Simply put the URL of their home page
http://sealevel.colorado.edu/
into the Internet WayBack Machine
https://archive.org/
and see for yourself.
This archived time line https://web.archive.org/web/20040719102733/http://sealevel.colorado.edu/2004_rel1.2/sl_ib_ns_cu2004_rel1.2_global.txt
differs from the current one
http://sealevel.colorado.edu/files/2015_rel4/sl_ns_global.txt
Changes have been made to the data resulting in an increase in the rate of reported sea level rise by nearly a millimeter per year.
And as I posted before, it looks like this:
http://oi59.tinypic.com/24e8482.jpg
“Changes have been made to the data resulting in an increase in the rate of reported sea level rise by nearly a millimeter per year”
And still, an ABSOLUTELY SCARY 3.2mm per year is best they can concoct !! WOW.!
3.2mm per year… no wonder they are panicking 😉
They’ve bumped it up to 3.3 mm/yr in their latest opus. I need to re-do that chart which is a year old now.
That 2015 sea level rise map is TOTALLY BOGUS !!!
Sydney area is pained dark red, yet has a rise of 0.65mm/year.
Like everything else sea level is ‘Adjusted’