
“If the facts don’t fit the theory, change the facts.”
- Albert Einstein
Einstein was just joking, but that is exactly what the Climategate team has done to the surface temperature record.
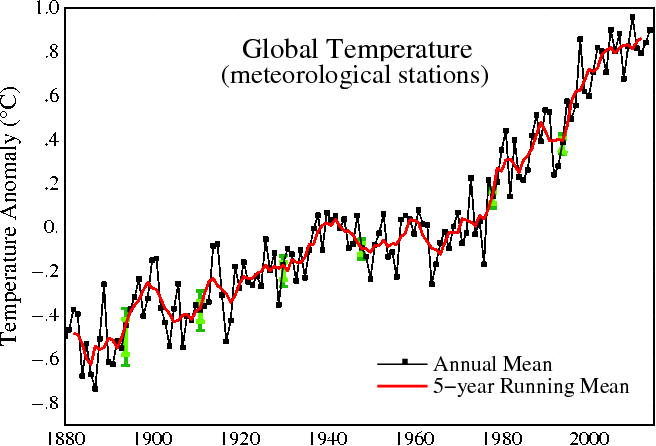
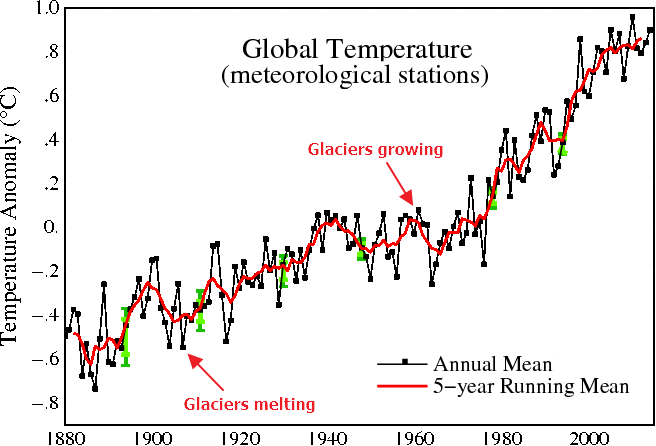
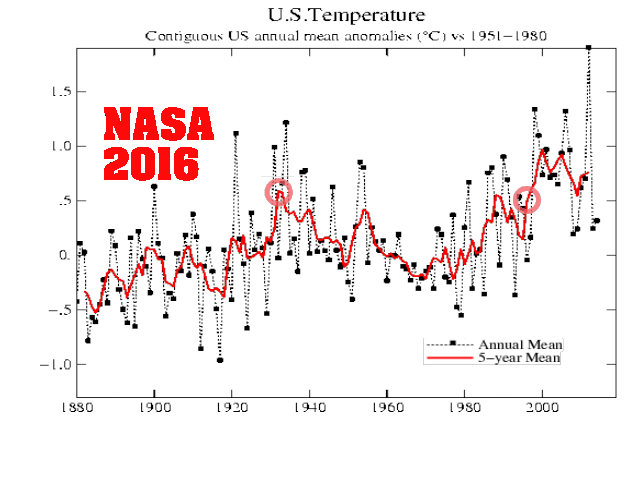
We have all grown used to seeing graphs like the one at above from NASA, showing nearly continuous global warming over the last 135 years – with a flat period between 1940 and 1980, and 1.2C warming from 1880 through 2000.
Much of climate science, journalism and public policy is based around the belief that these NASA graphs are an accurate representation of the temperature record, and that the apparent warming which is shown in the graphs is due to an increase in atmospheric CO2. It is therefore very important to understand the accuracy, consistency and integrity of these graphs.
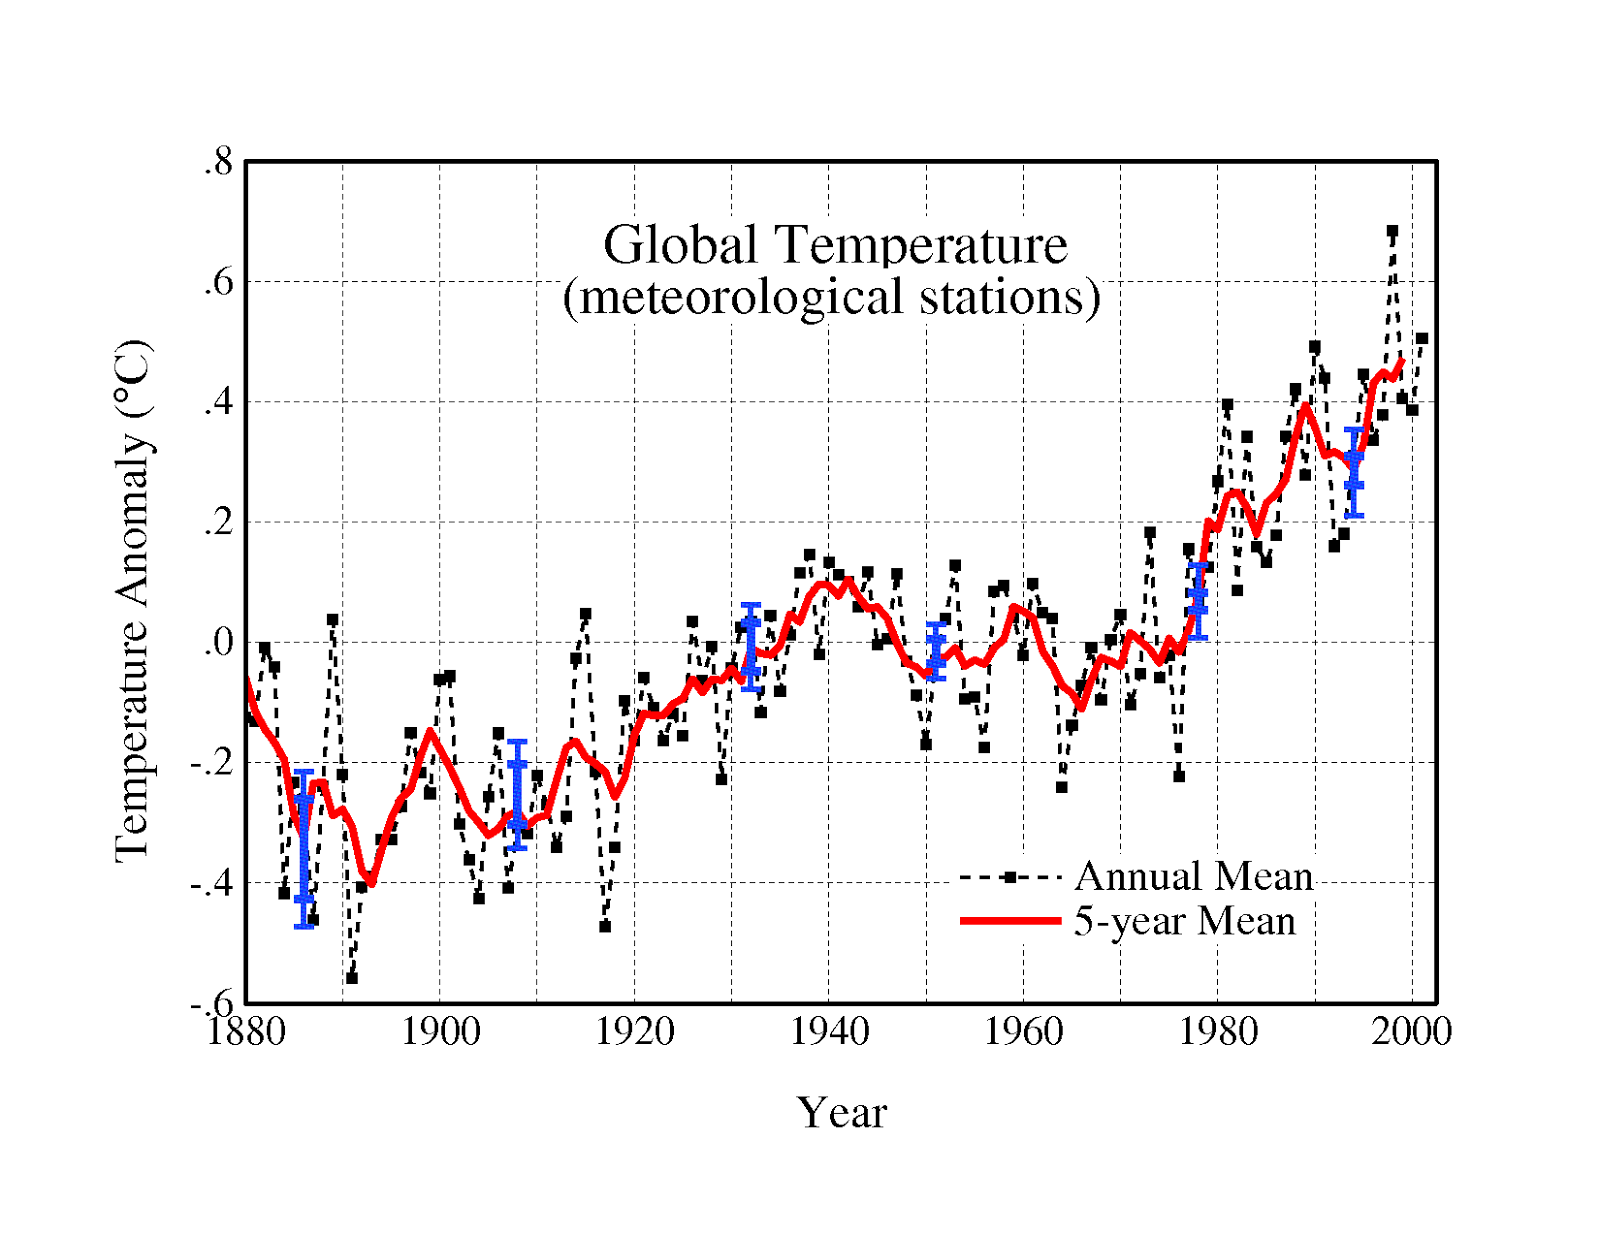
However, if we look at earlier versions of the same graph, we see something very different. The graph below was published by NASA in 2001, and showed 1975 as barely warmer than 1880 – with less than 0.6C warming from 1880 to 2000. The 2001 version showed only half as much warming from 1880 to 2000 as the 2016 version of the same graph above.
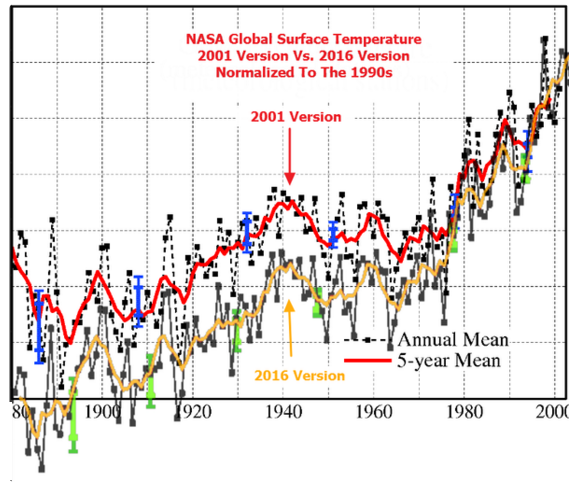
The recent increase of 0.6C in NASA’s reported warming over the 1880-2000 time period, is particularly troubling because the recent alterations extend far outside of their own error bars. The graph at right shows the 2001 version and the 2016 versions at the same scale, normalized to the most recent common decade. The blue lines represent the 2001 error bars, and the green lines represent the 2016 error bars. Note how the alterations are about three times as large as NASA’s reported error. This indicates a scientific process which is completely broken.
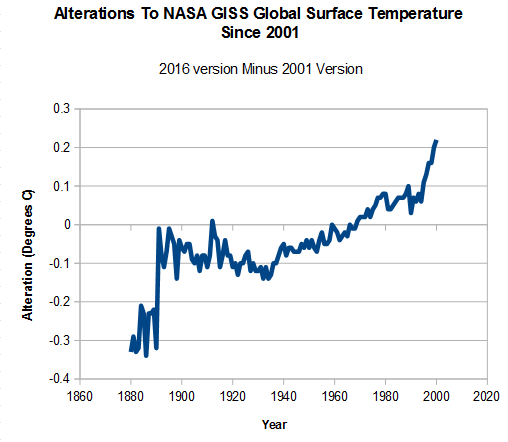
The graph below shows the changes which have been made to the NASA 1880-2000 temperature trend since 2001, a total of more than half a degree. The alterations have been almost as large as the entire trend reported in 2001, indicating a signal to noise ratio of close to zero. In other words, the NASA temperature graph is meaningless from a scientific point of view.
Going further back in time with published NASA temperature record, we see even larger discrepancies. NASA’s James Hansen in 1981 (below) showed a spike in temperatures around 1940, followed by nearly 0.3C cooling until the late 1960’s. This spike and cooling has been almost completely erased from the NASA temperature record.
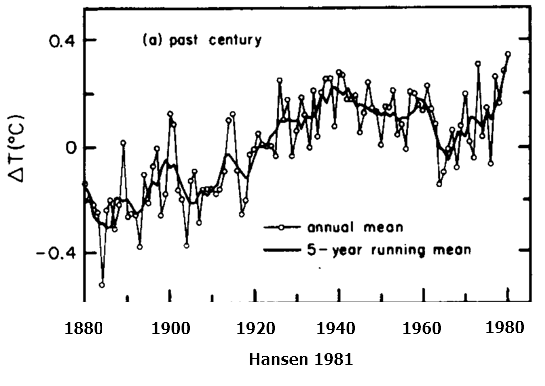
The image below overlays Hansen 1981 graph on the current NASA surface temperature record, and shows how pre-1980 temperatures have been cooled. By cooling the past, NASA increased the total amount of warming, removed the 1940’s spike, and removed the post 1940’s cooling.
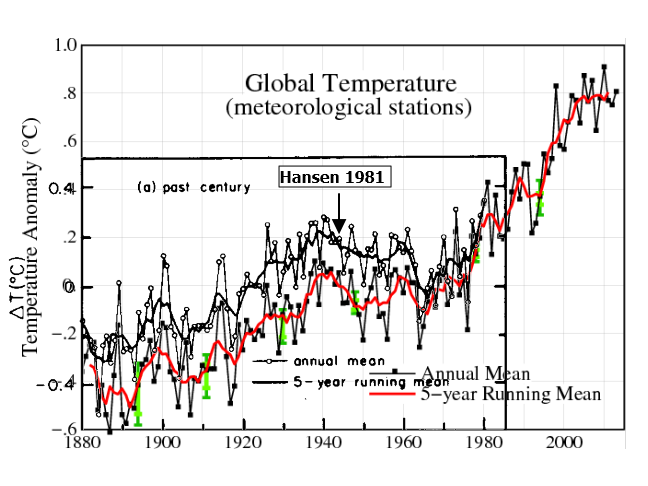
These alterations did not occur all at once, but rather have occurred in successive stages, where the past is made cooler to create the appearance of more warming. The amount of warming from 1880 to 1980 has been doubled since Hansen 1981.

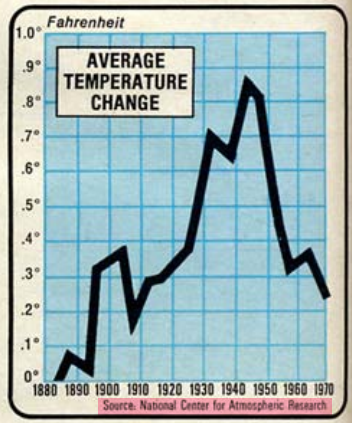
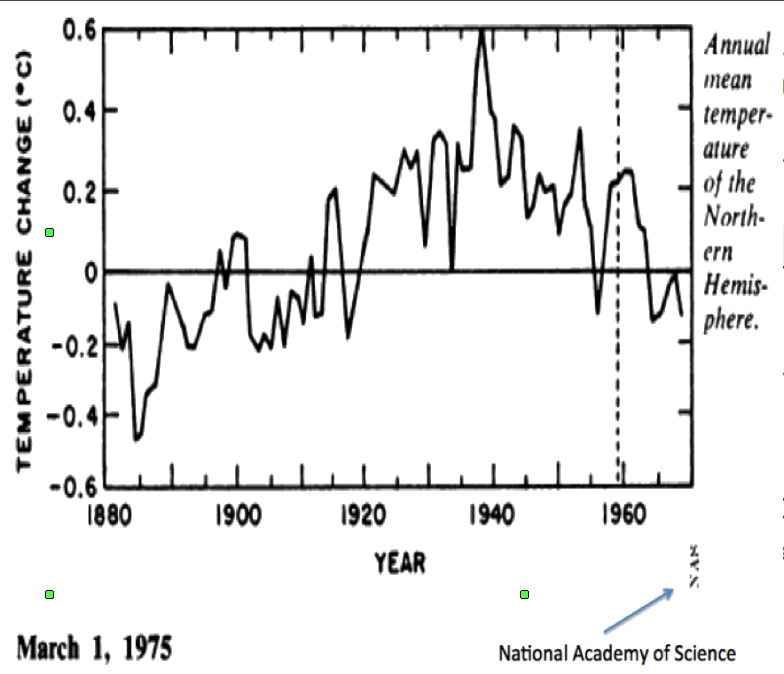
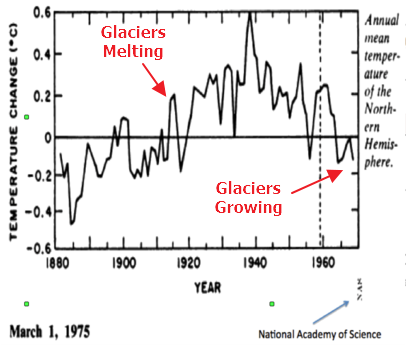
Before NASA was involved, the National Academy of Sciences and NCAR both showed even more post-1940’s cooling, and that Northern Hemisphere temperatures were no warmer in the late 1960’s than they were at the beginning of the 19th century. These graphs are completely different from the current NASA graph.
coolingworld.pdf Page 148 : understandingcli00unit.pdf
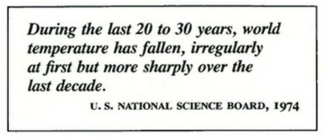
In 1974, the US Science Board reported a sharp cooling since World War II. The image below is from the November, 1976 issue of National Geographic
That same issue of National Geographic included the graph below, and the following text.
“Downward trend of temperature since 1938 has come nearly halfway back to the chill of the Little Ice Age 300 years ago”
This downwards trend has been nearly erased by NASA and NOAA.
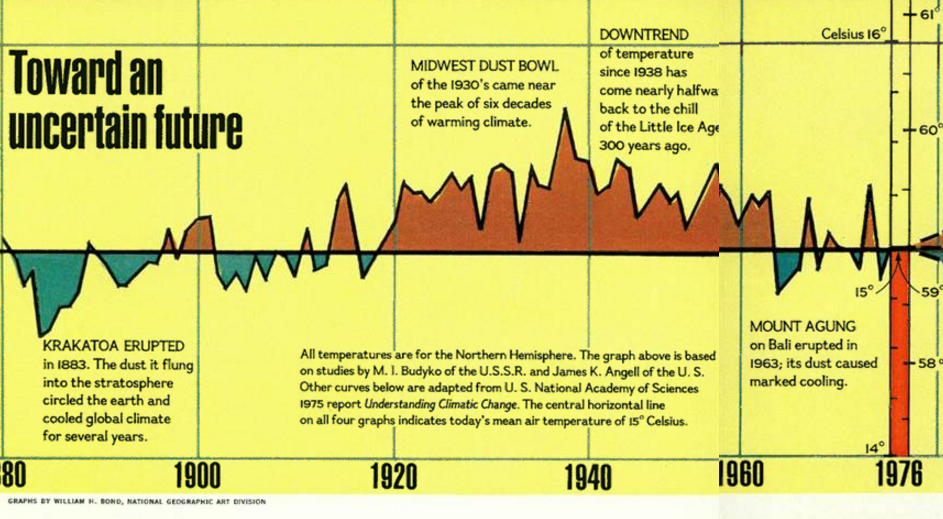
National Geographic : 1976 Nov, Page 614
During the 1970s, the American Association For The Advancement of Science reported a global cooling trend since 1940 – as did Columbia University
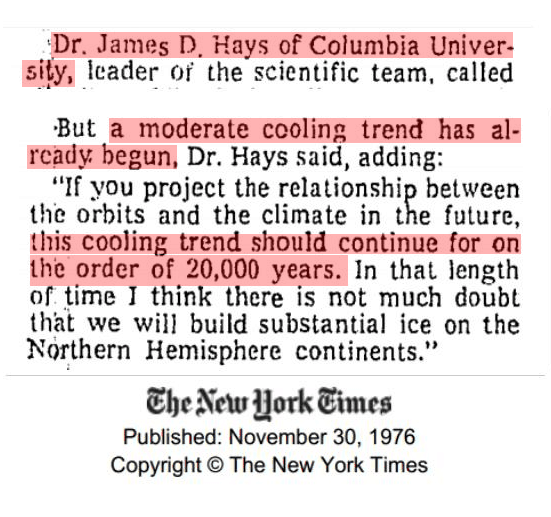

TimesMachine: November 30, 1976 4 Mar 1974, Page 1 – at Newspapers.com
In 1961 there was “unanimous agreement” among climate experts that Earth was getting colder. In 1979, the cooling was considered “indisputable” and NOAA reported about 1 degree F cooling since World War II
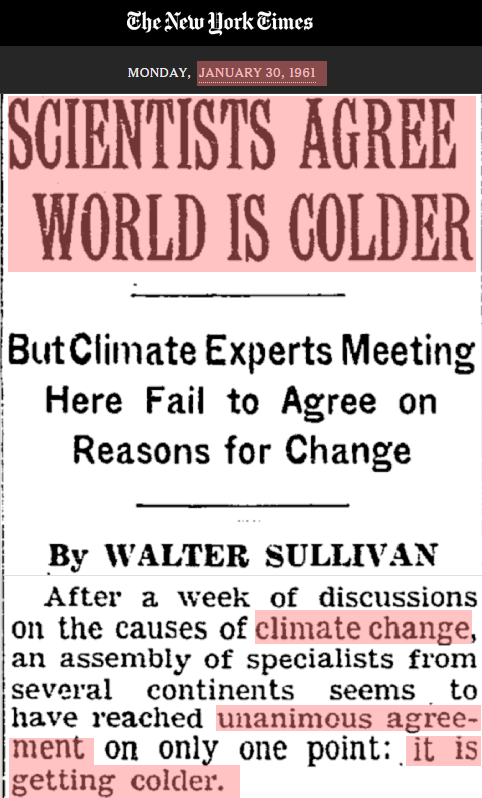
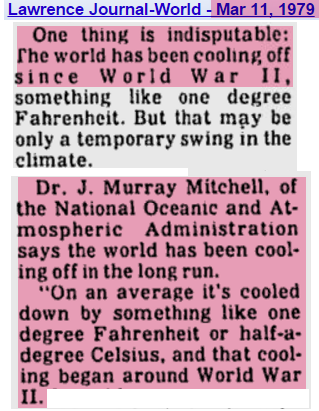
SCIENTISTS AGREE WORLD IS COLDER Lawrence Journal-World
The CIA warned that the cooling trend threatened political stability. The US and Russia mounted ‘large-scale investigations to determine why the Arctic climate is becoming more frigid” and the ice was getting thicker.
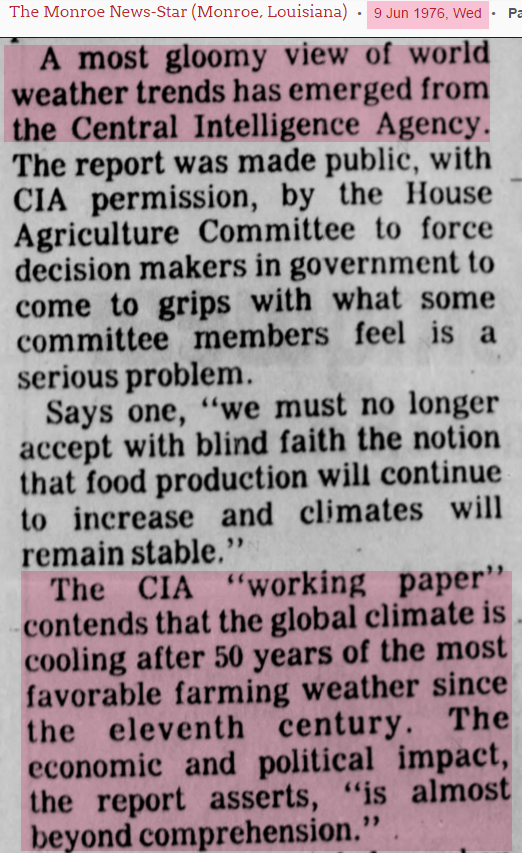
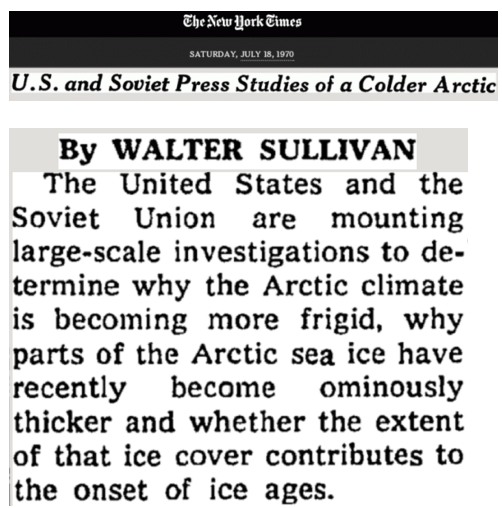
9 Jun 1976, Page 4 U.S. and Soviet Press Studies of a Colder Arctic;
Sixty theories were put forward to explain the cooling
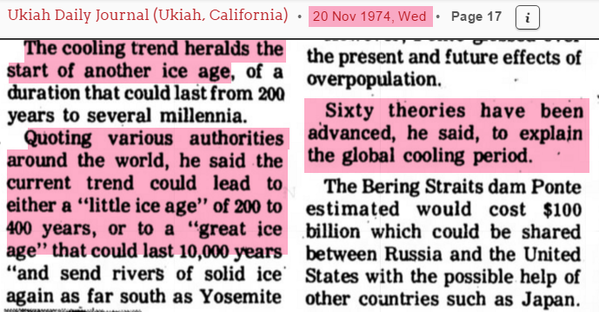
20 Nov 1974, Page 17 – at Newspapers.com
Further evidence for the cooling was that during the late 1950s and 1960s, glaciers were advancing for the first time in over a century.
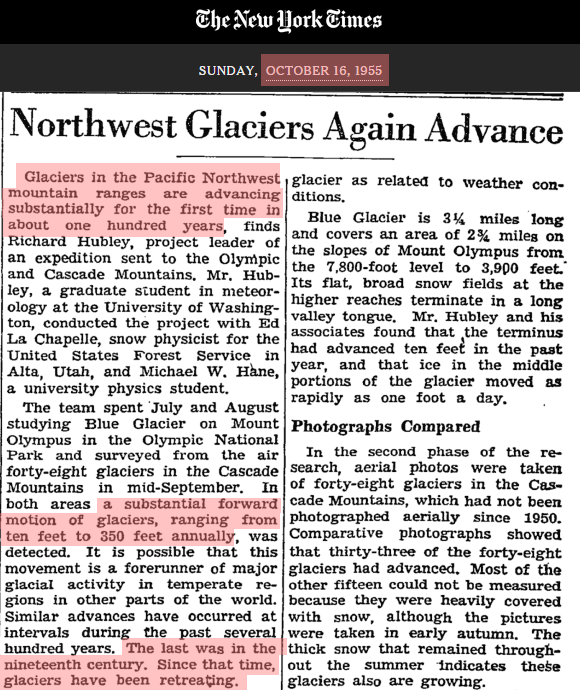
Glaciers Grow In Norway Northwest Glaciers Again Advance
This cooling was a big change from the previous decades. Glaciers were disappearing in the early part of the century, and many had vanished by 1923.
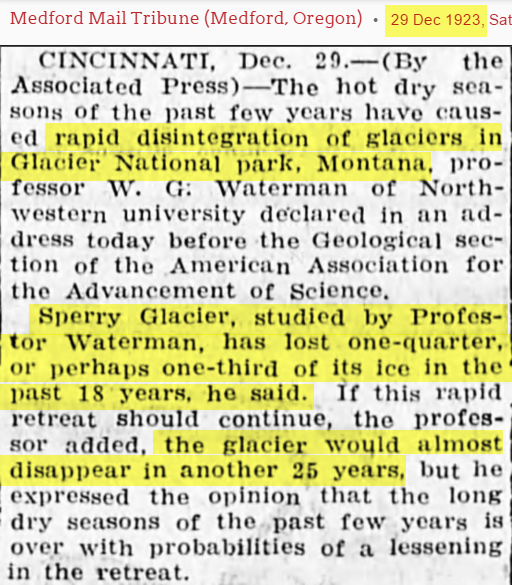
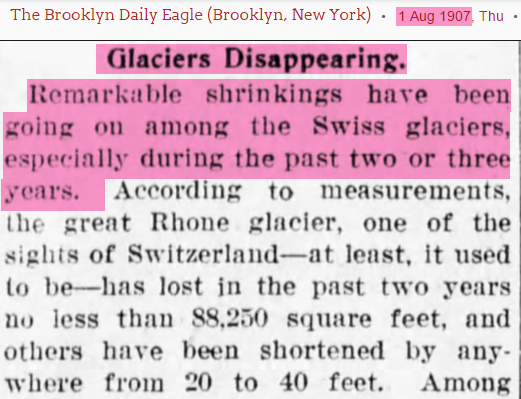
29 Dec 1923, Page 5 1 Aug 1907, Page 4
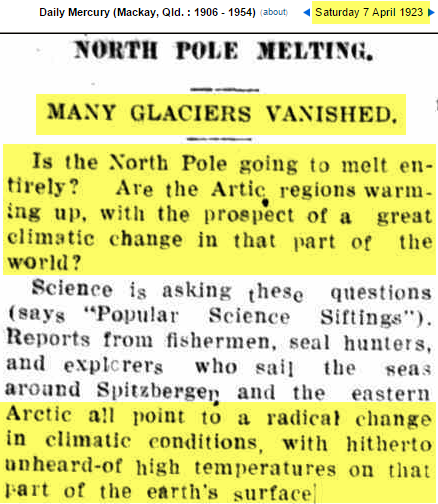
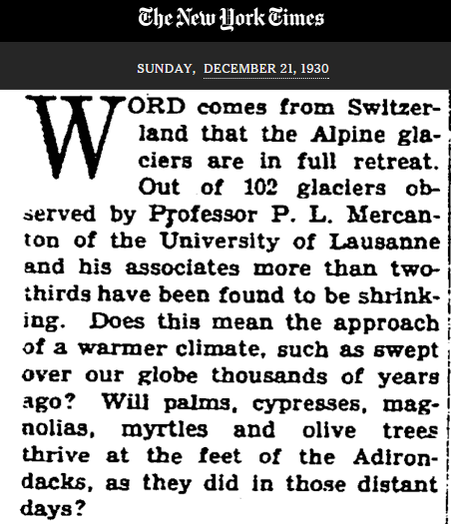
07 Apr 1923 Retreat of the Ice Rivers in the Alps
During the 1930s and 1940s, the glaciers of Norway and Greenland were rapidly melting and faced “catastrophic collapse.” By 1952 the glaciers of Norway and had lost half of their mass.
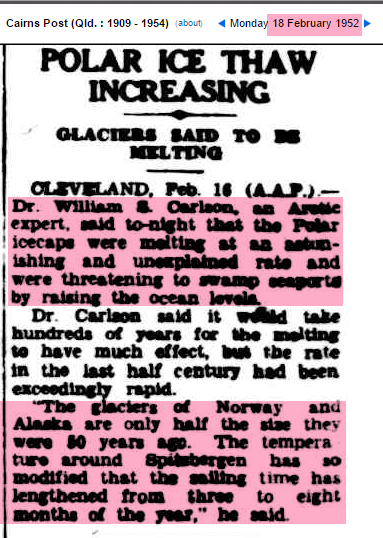

18 Feb 1952 17 Dec 1939, Page 15
National Geographic showed images of rapid glacial retreat in the Alps by 1940.


National Geographic : 1976 Nov, Page 594
Evidence for the earlier warmth and post WWII cooling is very compelling . So why does it no longer appear in the NASA temperature record? NASA shows the period during the 1960s when glaciers growing as warm, and the earlier period when they were melting earlier as cold. The NASA temperature record does not appear consistent with the evidence on the ground, whereas the 1975 National Academy of Sciences graph is consistent.
This Climategate E-mail provides a big hint as to what has happened to the data since 1975. Climate scientists wanted to get rid of the “1940s blip”
From: Tom Wigley <[email protected]>
To: Phil Jones <[email protected]>
Subject: 1940s
Date: Sun, 27 Sep 2009 23:25:38 -0600
Cc: Ben Santer <[email protected]>So, if we could reduce the ocean blip by, say, 0.15 degC,
then this would be significant for the global mean — but
we’d still have to explain the land blip.It would be good to remove at least part of the 1940s blip,
but we are still left with “why the blip”.
Removing the 1940s blip is exactly what NASA did. This is particularly evident in Greenland, Iceland and United States temperature data.
In 1999, NASA’s James Hansen reported that the US cooled half a degree since the 1930’s.
pubs.giss.nasa.gov/docs/1999/1999_Hansen_etal_1.pdf
Whither U.S. Climate?
By James Hansen, Reto Ruedy, Jay Glascoe and Makiko Sato — August 1999
in the U.S. there has been little temperature change in the past 50 years, the time of rapidly increasing greenhouse gases — in fact, there was a slight cooling throughout much of the country (Figure 2)
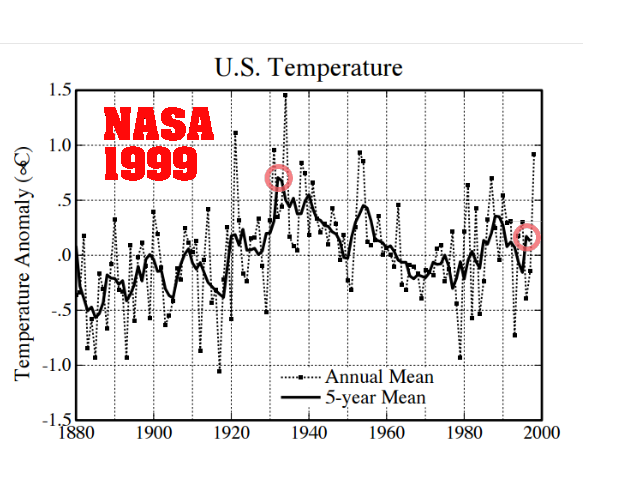
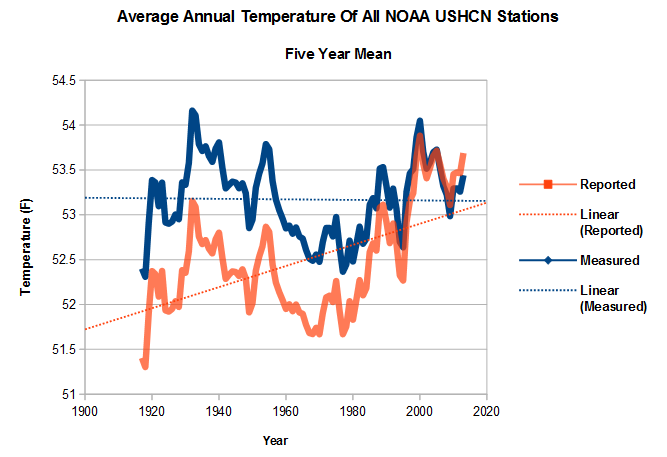
NASA now shows warming during that same period. NASA US temperature data is based on NOAA USHCN data, which is massively altered to create the appearance of warming.
The graph below shows how the NOAA data is altered. The blue line shows the averaged measured temperature at all USHCN stations, and the red line shows the average adjusted temperature. The warming trend over the last century is entirely due to “adjustments” by NOAA. Note how the “1940s blip” has been largely removed.
The image below shows the adjustments made by NOAA to the US temperature record – a total of 1.6 degrees F.
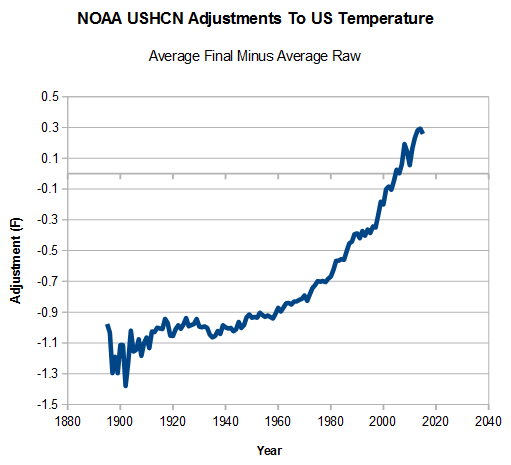
A large portion of these adjustments is due to NOAA simply making up data. If they are missing data at a particular station one month, they use a computer model to fabricate the temperature for that month. Since 1970, the percent of fabricated data has increased from 10% to almost half of the data. The US temperature record from NASA and NOAA is thus a completely meaningless fabrication, which bears no resemblance to the thermometer data it is derived from.

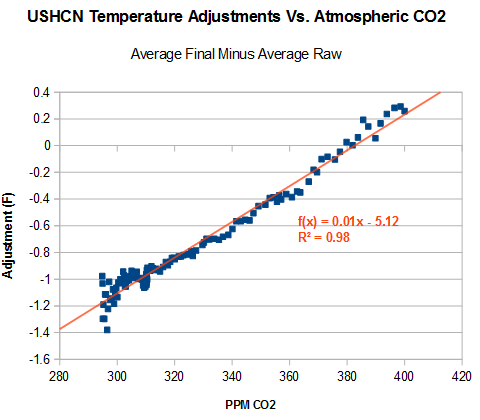
The data has been adjusted to match the increase in carbon dioxide. In other words, it is being forced to fit to greenhouse gas theory.
In summary, the NASA global and US temperature records are neither accurate, nor credible representations of reality.
“With four parameters I can fit an elephant, and with five I can make him wiggle his trunk”
- John von Neumann

Tony, you have expressed and documented this amazingly well. The best way I know to sum this up in one sentence is that if you take the vast number of long standing US stations, not corrupted by urban heat island affect, there has been virtually NO warming since at least the 1930’s. Nearly all the warming since 1880 took place between 1880 and 1940. Thus there is NO correlation between increased amounts of CO2 and temperature. Nothing remotely approaching any sort of climate crisis.
Reblogged this on The Grey Enigma.
Doing a count down here. Five, four, three, two, one… wait for it….
“But you have not presented ANY EVIDENCE that any of the adjustments are wrong!”
sarc off
Seriously though, how can anyone look at all those charts, examine the pattern of how the charts have changed, and still not come to the conclusion that the numbers are being purposefully altered to match an agenda?
Jason, just to spike the guns of the whiners here are my comments with research backing up what Tony says.
—Old thermometer readings—-
TOBS (Time of Observation
https://stevengoddard.wordpress.com/2015/01/06/fixing-the-past-at-the-ministry-of-truth/#comment-477742
March of the Thermometers
https://stevengoddard.wordpress.com/2015/01/18/how-gavin-cheated-to-create-the-required-talking-point/#comment-482838
Switch from glass to thermistors
https://stevengoddard.wordpress.com/2015/01/19/hansen-and-mann-hiding-the-other-decline/#comment-483233
https://stevengoddard.wordpress.com/2015/03/27/implausibly-deniable-propaganda-at-nsidc/#comment-510211
Move from LiG (Liquid in Glass) to modern equipment:
https://stevengoddard.wordpress.com/2015/01/19/hansen-and-mann-hiding-the-other-decline/#comment-483233
People should want to know why NASA can put a Man on the Moon but can’t manage to read a thermometer correctly!
Of course the punch line to your last sentence is that NASA can’t put a man on the moon anymore. I have heard various estimates, but IIRC one NASA administrator said that if NASA started today on a serious man-on-the-moon project, it would take about ten years to pull it off. Ten years, and we did it in seven the first time. Heck, we are buying second stage rocket engines from the Russians, and the only way we can get to the space station is by hitching a ride on a Soyuz.
How fallen are the mighty.
Oh, for any true CAGW supporters out there, sorry if I shocked you, but no, sceptics do not generally think we never went to the moon.
Commercial space companies will most likely beat NASA to the moon. There is the possibility of exploitable resources, after all.
Jason,
Many of us skeptics are Science Fiction aficionados and were glued to the TV or even traveled to Florida to see the shuttle lift-offs.
Most of the stuff the CAGW alarmists make up about skeptics would have us rolling on the floor in laughter if they were not so deadly serious. All the made up crap is enough to convince you it is whacked out politics before looking at any of the science.
Hey Gail, yes, I was there for the first launch as well, with a press pass! I guess that it has been long enough that I can confess. A, uh, friend, made up some stationary with a fake letterhead of an imaginary film studio that was making a documentary of the first launch. NASA responded that we should bring photo IDs and they would issue our passes at the front gate. We did, and they did! 🙂
Putting a man on the moon (or any one of a multitude of things we now take for granted) required the science involved to work; otherwise the moon shots would have missed, or never gotten off the ground to begin with.
Climate science doesn’t have to work; it only has to appeal to the right people.
Excellent Tony!
Another point to note is Ex-Senator Wirth and Hansen played their dirty tricks on Congress to get them to believe in CAGW in 1988. Clinton signed the UN Framework Convention on Climate Change on 12/06/92 and it was ratified. The USA has poured BILLIONS into the Climate Change fiasco. So one question WHY IN HADES does the USA have missing DATA and WHY is it INCREASING since 1988 and not DECREASING???
This is me channelling one frequent polemic poster here: “If the facts don’t fit the theory, change the facts;” exactly right.
This litany scientific missteps continues to be ignored by the “Main Stream” news outlets and will continue to be ignored. If Bernie or Hillery win in November it will never see the light of day.
Of course we have a long way to go until the election and anything can happen but the fact is that despite the press playing up the divisions in the Republican party the Democrats are fragmented worse right now. As things stand now I really don’t think that Hillary has much of a chance. All indications are her support is already going the wrong direction!
When it comes to politics the JP Morgan owned MSM is going to drive the public to pick the candidates THEY want and not what is best for US citizens. They have done that for over one hundred years and the Elite have gotten richer and the American Citizen has been saddled with debt.
Now…
Gail, you are probably aware that the main point of contention for the occupation of the wild life building in Oregon is that the BLM has been actively burning out the ranchers there so that their land can be bought cheap and then have the rights sold off. Yesterday the county fire chief quite in protest after he discovered that some of the troublemakers in town were in fact FBI undercover agents pretending to be militia.
No Jason I was not aware of that but it does not surprise me at all. (references please for my collection)
The goal has alway been to drive Americans off the land and into ‘sustainable housing’ aka micro-mini city apartments. The Elite want to eliminate the riff-raff from their hunting preserve and they also seem to be using Federal Land for collateral for the loans to the Federal Government.
A group of farmers warned about that over a decade ago. Somewhere I have the references….
AHHHh yes the great Derry Brownfield, may he rest in peace.
“Our Land: Collateral for the National Debt” by Derry Brownfield Dec. 3,2008
MORE from the farmers:
HIJACKING THE HEARTLAND
HOW TO BECOME A SERF IN ONE EASY STEP
BLM setting unattended fires and burning cattle and homes https://www.youtube.com/watch?v=2zvrrQbjepc Videos of burning start at 3:15
Harney Fire Chief resigns https://www.youtube.com/watch?v=SB6m7x3QDAg
Sorry to be brief, but am seriously multitasking at the moment!
Thanks Jason.
The data just keeps building up that we have a criminal and immoral government.
RAH – another indication.
NBC/WSJ.polling is not getting any attention.
Dec 14 2015
In addition, only 20 percent [Record high – 2009 May 7-9 Satisfied — 35%] of the public believes the country is headed in the right direction, versus a whopping 70 percent who think it’s on the wrong track. And 73 percent say they want the next president to take a different approach from President Obama’s. “This will become a high hurdle for the Democrats at some stage of the 2016 election,” says Yang, the Democratic pollster.
http://www.nbcnews.com/meet-th… [Hidden way down in the column]
Any polling outfit not taking into account the 73% is push polling and not fit for consumption.
73 is the new 97 percent.
Another keeper for my ‘data fraud’ file, and another post I will share with the masses. Thanks Tony!
Very much a keeper Gator. It is nice to have it all laid out in one place. Makes it easier to ship off to others.
One more smoking gun to add, Tony
None of the previous temperature data from either NOAA or GISS has been archived. It is only through the efforts of independent bloggers and others, who have privately kept their own records or used Wayback, that we can keep track of what has been going on.
About the only thing we can glean from the official sources are the graphs themselves , which were published at the time and cannot be easily destroyed.
Any reputable scientific outfit would always keep prior data, and be able to account for the differences.
I have had many debates with people who denied that any adjustments had even been made. At least now they seem to accept them, and have changed tack to expect us to prove why the adjustments are wrong.
Add CRU to the list, at least according to
The HARRY_READ_ME file was a long-running commentary, describing the disconcerting breath of problems he encountered while attempting to edit and organize his climate data sets at CRU. These challenges included CRU loss of data, predecessors accidentally deleting important calculations, receiving poorly organized data from various parts of the world, and having to work with a glitchy array of customized computer programs. In circumstances such as these, the writer was forced to make many judgment calls on how to proceed, despite admitting, “I haven’t had any training in stats in my entire life.”
See more at: http://www.newsbusters.org/blogs/joseph-rossell/2014/11/17/climategate-after-five-years-ten-credibility-killing-quotes-leaked#sthash.sce4R0n9.dpuf
DD More, yes, very important to remind newcomers about the Harry_Read_Me file. I have never met a CAGW enthusiast who had even heard of it. Whoever Harry was, I wonder if he was the person who leaked the emails and files. Thanks, Harry, wherever you are!
As I read the Harry_Read_Me file, I kept thinking of what the FDA or FAA would have done to me if my labs records were in that poor a shape!
Heck ….
Now tell me how a few misapplied eartags or missrecorded numbers are enough to destroy a man’s entire life but the SAME government is willing to ignore a complete mess, including missing records, and other evidence of wrong doing. Not only ignores the mess but uses that crappy information produced as an excuse to kill hundreds of people a year?
Gail that reminds me of the “Larry the Cable Guy” thoughts on cows.
Everyone concentrates on the problems we’re having in Our Country lately: Illegal immigration, hurricane recovery, alligators attacking people in Florida . .. .. . Not me — I concentrate on solutions for the problems — it’s a win-win situation. * Dig a moat the length of the Mexican border. * Send the dirt to New Orleans to raise the level of the levees. * Put the Florida alligators in the moat along the Mexican border.
Any other problems you would like for me to solve today? Think about this: 1. Cows
COWS
Is it just me, or does anyone else find it amazing that during the mad cow epidemic our government could track a single cow, born in Canada almost three years ago, right to the stall where she slept in the state of Washington? And, they tracked her calves to their stalls. But they are unable to locate 11 million illegal aliens wandering around our country.. Maybe we should give each of them a cow.
Read more: http://www.hobotraveler.com/jokes-sent-to-andy/wisdom-of-larry-the-cable-guy.php#ixzz3xLrHWvA7
Yeah, Amazing, They want us to tag and track all our livestock and yet they have no problem with possibly criminal and disease ridden illegals flooding across our boarders. — schizophrenic much?
Another goody from Doreen Hannes and Sharon Zecchinelli. — Two ladies I have a lot of respect for. (I worked with them on the NAIS issue via e-mail.)
But the USDA has zero problem with Con-Agra selling feces covered meat. (And no I am not kidding the new regs allow washing of the meat instead of condemning it like the old regs.)
So why do they want to tag granny’s flock of chickens?
+10
Getting rid of the 1940ish peak was one of the prime aims of the homogenisation process.
There are so many instances like Reykjavik, from all around the glode, that it has to have been intentional from the word go.
http://s19.postimg.org/94wuptxdf/quix.jpg
“There are so many instances like Reykjavik, from all around the glode, that it has to have been intentional from the word go.”
A husband comes home from work once and there is lipstick on his collar; yeah, maybe some lady stumbled against him on the bus. Once he came home and smelled like perfume. Maybe it really is just a new cologne that the barber rubbed on him after his shave. But he comes home three nights a week with lipstick? And perfume? And missing a sock? There just might, just might, just might be a problem….
🙂
The adjustments always remind me of this song. (Clam Chowder sung it at BosCon)
https://www.youtube.com/watch?v=y5gydvllKdM
Ha! Good song! Well, I am no climate scientist, so if they say 2015 is “the hottest year evah!” then it MUST be true!
Hubby’s out so I am listening to Celtic Thunder on his computer. Nice group!
“It is a huge mistake to theorize before one has data. Inevitably, one begins to twist facts to suit theories instead of theories to suit facts”.
https://www.youtube.com/watch?v=IkkD6BXFYRA
Reblogged this on Climate Collections.
Really a great presentation Steve. Thanks.