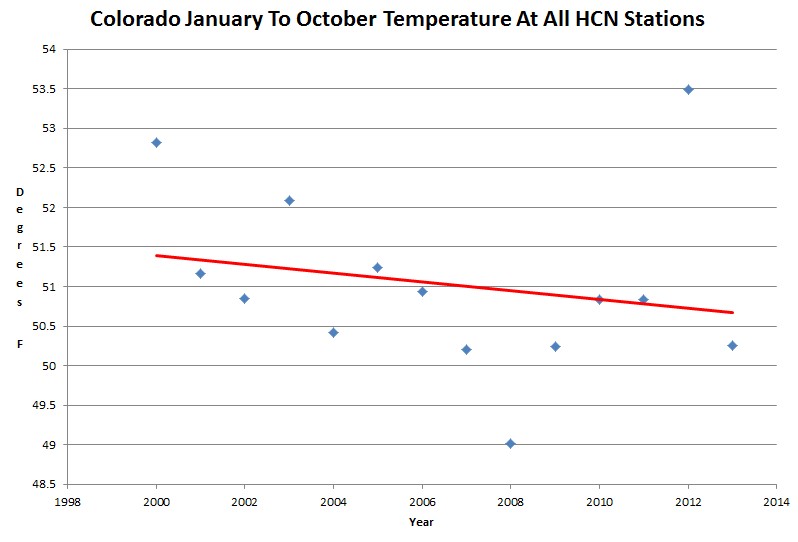
It turns out that 2012 temperatures were not the “new normal” after all.
Index of /pub/data/ghcn/daily/hcn/
The 3 top years and the 1 lowest are all outliers.
So a straight line from the 2001 point to the 2013 point is a more correct trend line.
Don’t worry, once homogenized, normalized, pasteurize, average, adjusted, suitably weighted, and changed the data, 2012 will be the official new normal.
Oh the hottest year ever, for sure. Maybe if some climate scientists froze to death, then we would make some headway.
So true 🙂
Your email address will not be published. Required fields are marked *
Comment *
Name *
Email *
Website
Save my name, email, and website in this browser for the next time I comment.


The 3 top years and the 1 lowest are all outliers.
So a straight line from the 2001 point to the 2013 point is a more correct trend line.
Don’t worry, once homogenized, normalized, pasteurize, average, adjusted, suitably weighted, and changed the data, 2012 will be the official new normal.
Oh the hottest year ever, for sure. Maybe if some climate scientists froze to death, then we would make some headway.
So true 🙂