
Disrupting the Borg is expensive and time consuming!

Google Search
-
Recent Posts
- You Can’t Fool Mother Nature
- Cattle And The Climate
- One Atomic Bomb Per Hour
- New Video : Analyzing Oil And Gas
- Is Antarctica Melting?
- High Speed Analysis And Visualization
- El Nino To The Rescue?
- Fake News Update
- Growth Of Antarctic Sea Ice
- 65 Years Of Progress!
- El Nino To The Rescue?
- Worst March Drought On Record
- ChartGL Process Control Demo
- The Biggest Money Laundering Scam
- Drought In The Headwaters Of Lake Powell
- Unrealistic Expectations Of Water Availability
- Did Bill Gates Do This?
- Worst March Drought On Record In The US
- The Real Hockey Stick Graph
- Analyzing The Western Water Crisis
- Gaslighting 1924
- “Why Do You Resist?”
- Climate Attribution Model
- Fact Checking NASA
- Fact Checking Grok
Recent Comments
- Bob G on You Can’t Fool Mother Nature
- Gordon Vigurs on You Can’t Fool Mother Nature
- arn on Cattle And The Climate
- Bob G on Cattle And The Climate
- Robertvd on Cattle And The Climate
- Bob G on Cattle And The Climate
- Robertvd on Cattle And The Climate
- Billyjack on Cattle And The Climate
- Bob G on Cattle And The Climate
- Robertvd on Cattle And The Climate
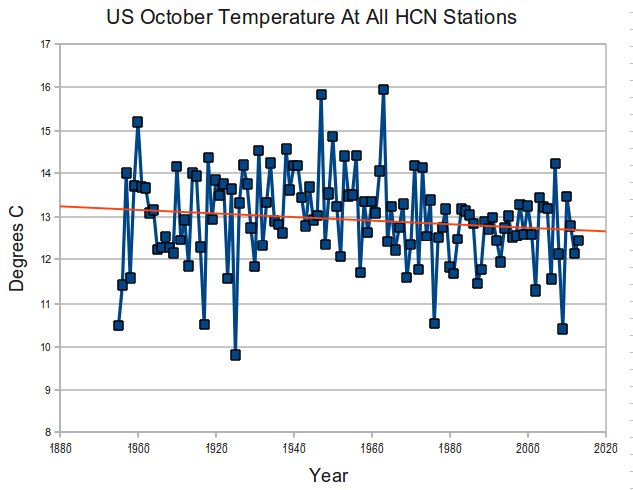
You are not allowing for alarmist temperature jacking and use of urban heat island effect. Without that, there is absolutely no conclusive sign of significant warming.
Note the similarity between what happened in the 1970’s and what’s happening since the middle of the last decade. The only period where there is evident trend for increasing averages is during the 1920’s and 1930’s.