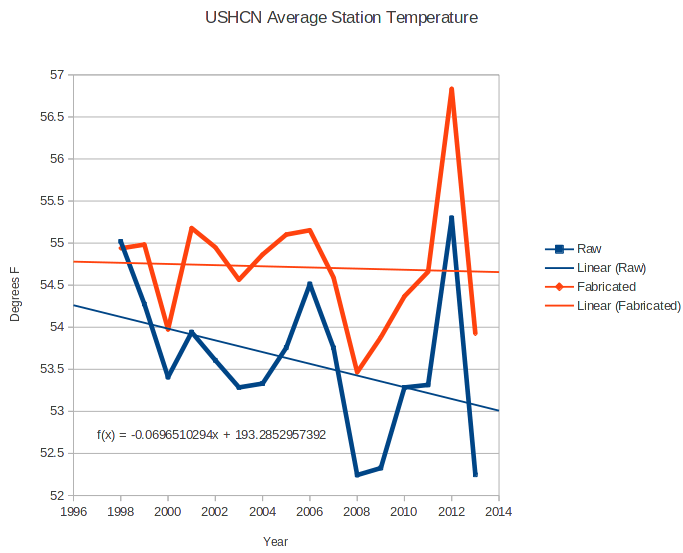
USHCN raw station data shows an average of 7 degrees/century cooling since 1998, while their fabricated (infilled) data shows almost no cooling. The fabricated data is data which has no underlying station data, and is manufactured by NOAA.
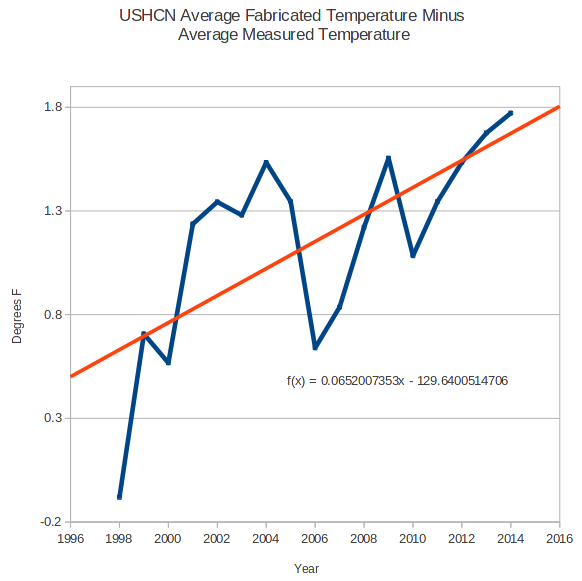
The next graph shows the divergence between the fabricated data, and the actual measured data. They are diverging at 6.5 degrees/century
Astonishingly, a number of well known scientists have been interviewed by the press saying that this is all good, and that my complaints should be ignored.
It defies explanation that USHCN would do this, and even more astonishing that anyone defends this practice of data tampering which destroys any meaning in the temperature record, and makes it both useless and destructive to science.


Explanation is…..
There is explanation it is just not forthcoming. Stay with it, adjustments are not required for accuracy.
BTW does anyone ever compute change/station then average the results? Seems nonsensical to combine high/low wet/dry temps all together then average.
High low as in elevation, not readings.
Atmosphere is 3 dimensional. Surface readings are essentially 2 dimensional.
The lower troposphere is very thin compared to horizontal distances between stations.
Snow/ ice persists all year just 2500m above sea level here in B.C…..
Just throw this in their face Steve..
http://wattsupwiththat.files.wordpress.com/2013/03/giss-global-temps.gif
Rule by experts. That’s the system that’s been under construction for a century or so. Many people are now well conditioned to deferring to people with degrees, titles, and licenses instead of thinking for themselves.
Do you know of any experts who actually think for themselves?
“To thine own self be true”
Polonius:
This above all: to thine own self be true,
And it must follow, as the night the day,
Thou canst not then be false to any man.
Farewell, my blessing season this in thee!
Laertes:
Most humbly do I take my leave, my lord.
Hamlet Act 1, scene 3, 78–82
.
“Incestuous, homogeneous fiefdoms of self-proclaimed expertise are always rank-closing and mutually self-defending, above all else.”
-Glenn Greenwald
A scientist has humility.
An expert has pride.
HUMILITY: Reality is what I observe. E.g., Einstein: E = mc^2
PRIDE: Reality is what I calculate. E.g., von Weizsacker: Nuclear binding energy equation
Thread bummer.
It smells. That said, I want to see a record of all the adjustments and all the reasons for the adjustments. I keep reading that TOBS was an issue and assume it is among the primary causes of adjustments.
I downloaded a few USHCN flat files and imported them into Excel and did some minor pivot table analysis. Which actually reminds me of another question. I asked on Judith Curry’s blog, but no one answered yet.
I noticed that all TMAX and TMIN recs for Alabama are rounded to the nearest whole numbers. Why is this? Since we’re talking about climate change anomalies in matters of fractions of degrees, I expect decimal places. What am I not thinking about correctly?
My questions (apologies if they’re lame — consider the source):
1. Are we still recording temperatures at the wrong times?
2. Can we see the records of every station with adjusted temperatures and the reasons for the adjustments?
3. The data I downloaded was rounded to the nearest whole number. Is this the same for all USHCN data? If so, why?
4. Do the precipitation and snow records get adjusted like the temperature records?
Regarding your question: I noticed that all TMAX and TMIN recs for Alabama are rounded to the nearest whole numbers. Why is this? Since we’re talking about climate change anomalies in matters of fractions of degrees, I expect decimal places. What am I not thinking about correctly?
The answer is kind of a “it depends”. Generally temperature measurement devices (thermocouples, thermometers, RTDs, and thermistors) are typically calibrated to within 1 degree. Thermocouples aren’t much better than +/- 1 degree. The others can be calibrated more accurately. So the real measurement precision depends on the measurement device and it’s calibration.
Thus, if you measure a high temperature of 83.22 deg F, on a device calibrated +/- 1.0 def F, that fractional measurement is within the error band, and should be dropped. The fact that a digital readout displays decimal places does not automatically make those fractional values meaningful.
No one seems to be concerned with correctly labeling the error band or uncertainty band when discussing those climate change “anomalies” in fractions of a degree. Mainly because those “anomalies” are less than the measurement error, and being truthful about that might impact the grant gravy train. (my opinion)
Odd the approval polls of political figures are very quick to point-out their +/- 3% accuracies…….
This makes sense. Thank you. Now that Friday night is here, I finally caught up on the comments thread on Zeke Haus Father’s first post about adjustments Judith Curry’s blog. (What a boring life I just admitted to. 🙂
The error band question was mentioned several times by a commentor who seemed to be a “math” guy. His comments garnered little attention from Steven Mosher or Zeke H. They were not directly on topic, but I think your point and his about an error band are important to address.
In that thread on the other blog, another question about actual vs BEST reports for Portland data in 1950 was largely ignored too. According to one commentor and then echoed several times by David Springer, the manually kept record and the BEST data differ by about 0.7F — BEST was 38.1 vs reporting station 38.8.
I tend to give the technicians and scientists in the field and in the labs the benefit of doubt. But what Tony brings to light on this blog and now the Portland data make me wonder how many data issues will be found across the board as people begin looking at it in increasingly granular detail.
Well, it makes sense. If human observers have no idea how to read a thermometer, non-existent observers of imaginery thermometers certainly do not. As Harry said in his readme file:
[I]”Unbelievable – even here the conventions have
not been followed. It’s botch after botch after botch.”[/I]
http://www.anenglishmanscastle.com/HARRY_READ_ME.txt
stevengoddard:
Isn’t the definition of an expert “some SOB from outta town?”
The Boss’s daughter’s husband or maybe the boss’s wife’s brother (making it what we call a “brother in law” deal …)
I hear there are lots of what we call “sister-in-law” deals. The mischief universe may be twice as big as experts originally calculated.
———-
Note to self: File in the “Worse Than We Thought” folder
You are doing great work here Tony. But this is a much bigger issue. Fraud is rampant in all areas of science. Many years ago in a past engineering life, I was asked [and I refused] to ‘massage’, really, completely fabricate data, just to uphold the illusion that the eminent doctor’s theory was sound and to sell equipment that was based on the hugely flawed theory. The problem is that science is usually run by people with a lot of credentials but who are woefully underdeveloped people. If someone is personally identified with a pet theory they are famous for, or for a lifetime body of work, they will do ANYTHING to protect that prestige. Personal attack, academic sabotage, maybe even more. Also. MONEY. If millions or billions are at potential stake, research and experiments will ALWAYS be designed to avoid problematic data or undesirable results. Deaths will be covered up, undesirable data will be faked or discarded altogether. Antidepressants are less effective than placebo. From the article:
http://www.dailymail.co.uk/health/article-1292288/Never-trust-expert–Ever-wondered-health-advice-contradictory-Its-thirds-medical-research-wrong-fraudulent.html
“A study two years ago revealed that 23 out of 74 antidepressant trials were not published.
All but one had found the drugs to be more or less ineffective compared with a sugar pill placebo”
John Ioannidis does some great work investigating this – http://www.theatlantic.com/magazine/archive/2010/11/lies-damned-lies-and-medical-science/8269/
There is so much more to say on this issue, but I am glad you are calling BS on what you are seeing.
Additional information on events in late August 1945 might explain the intriguing similarity between the old USSR and the new USA. This may be a mere coincidence.
If not a coincidence, these events may be linked:
1. Fear and Chaos in 1945:
https://dl.dropboxusercontent.com/u/10640850/CHAOS_and_FEAR_August_1945.pdf
2. Nuclear secrets lost for 57 yrs:
http://news.bbc.co.uk/2/hi/asia-pacific/2170881.stm
3. Humility and acceptance of reality – the foundations of science, religion and democracy – were the losers of WWII: The winners were false pride and totalitarian disrespect for truth, God and human dignity:
https://dl.dropboxusercontent.com/u/10640850/Humanity_Lost_WWII.pdf
It is becoming increasingly difficult to place any faith in land-based temperature measurements that are being performed by government agencies that seem hell-bent on proving that human fossil fuel emissions are warming the planet.
Based on the investigative work of Steve Goddard and other observers, there is now very little doubt that NASA and NOAA have been manipulating temperature data in an attempt to create a global warming signal that, in reality, doesn’t exist. This politicized measurement process has produced tainted datasets that bear no resemblance to actual raw temperature data.
Both NCDC and GISS have morphed into “political science” operations whose prime directive is to confirm the pre-ordained conclusions of powerful political entities who fund their research and pay their salaries. Both agencies should be investigated for data tampering, and those who are found to have engaged in fraud should be prosecuted.
The new normal for 300 mbar through 850mbar temperatures have much to do about a collapse of “The Clueless Scientists” credibility.
Solar Cycle 24 has introduced some unique observations especially from THEMIS, which unfortunately will not be published.
http://www.intellicast.com/National/Analysis/UpperAir300.aspx
http://www.intellicast.com/National/Analysis/UpperAir500.aspx
http://www.intellicast.com/National/Analysis/UpperAir850.aspx
Where is that anonymous guy apparently from NCDC who was commenting on how this all came about because “they included more data and they told everybody they were making this all more accurate”
Ice still on Lake Superior in July: https://twitter.com/TillyLaCampagne/status/484776177794441216/photo/1
Antarctica – Coldest June on record: http://iceagenow.info/2014/07/antarctica-coldest-june-record/
I watched both SG and WUWT at the Heartland conference. The Watts presentation seemed to confirm the smearing of data proposed by SG and confirmed the original postings here. The UHI effect further shows that they are in fact fabricating/using S### data to uphold the AGW scenario. LOL Watts conclusion was I believe that the data is biased to support the AGW scenario
Can someone help me understand NOAAs claim that the average monthly world temperature has been increasing for 351 months … how can they make this claim …
http://www.ncdc.noaa.gov/sotc/global/2014/5
It defies explanation that USHCN would do this
It should.
Unfortunately, it doesn’t.
They are using the UHI effect to prove the claim of increasing temperature. They stations they are losing are rural, and the temperatures they are using to infill the data are urban. The higher urban temperatures are counted twice, and the rural temps are not counted at all.