
This guy is awesome!
Disrupting the Borg is expensive and time consuming!

Google Search
-
Recent Posts
- Cattle And The Climate
- One Atomic Bomb Per Hour
- New Video : Analyzing Oil And Gas
- Is Antarctica Melting?
- High Speed Analysis And Visualization
- El Nino To The Rescue?
- Fake News Update
- Growth Of Antarctic Sea Ice
- 65 Years Of Progress!
- El Nino To The Rescue?
- Worst March Drought On Record
- ChartGL Process Control Demo
- The Biggest Money Laundering Scam
- Drought In The Headwaters Of Lake Powell
- Unrealistic Expectations Of Water Availability
- Did Bill Gates Do This?
- Worst March Drought On Record In The US
- The Real Hockey Stick Graph
- Analyzing The Western Water Crisis
- Gaslighting 1924
- “Why Do You Resist?”
- Climate Attribution Model
- Fact Checking NASA
- Fact Checking Grok
- Fact Checking The New York Times
Recent Comments
- Gordon Vigurs on Cattle And The Climate
- Gordon Vigurs on Cattle And The Climate
- Jack the Insider on Cattle And The Climate
- Crispin Pemberton-Pigott on Cattle And The Climate
- conrad ziefle on Cattle And The Climate
- Billyjack on Cattle And The Climate
- Bob G on One Atomic Bomb Per Hour
- Bob G on One Atomic Bomb Per Hour
- Bob G on One Atomic Bomb Per Hour
- Jack the Insider on One Atomic Bomb Per Hour
How do you deal with the idiots? I want to bang my head against a wall after 10 mins of conversation.
It is much more fun making them bang their own heads. Change your strategy.
You are a Master of the technique Gator.
Gator is a trolljitsu Orange belt.
He is sniggering whilst beating them with their own posted words. Poor Hopeless, she never had a chance.
You guys are too kind, I simply give them enough rope, and leave the knot tying to them.
Gator gets awarded the ” Biggest Billy Goat Gruff” trophy as the Regular Poster who best says,
Well come along! I’ve got two spears,
And I’ll poke your eyeballs out at your ears;
I’ve got besides two curling-stones,
And I’ll crush you to bits, body and bones.
That was what the big billy goat said. And then he flew at the troll, and poked his eyes out with his horns, and crushed him to bits, body and bones, and tossed him out into the cascade, and after that he went up to the hillside. There the billy goats got so fat they were scarcely able to walk home again. And if the fat hasn’t fallen off them why, they’re still fat;
http://www.pitt.edu/~dash/type0122e.html
http://www.nebraskagoats.com/images/Zeus.JPG
Yes,
I bow too you sir.
Obviously, my methods are much to subtle.
One technique I use is to just keep asking them to show me any dataset that has warmed at even the lowest trend given by the IPCC in 2001. Here they said it would warm at least 1.4C from 1990 to 2100. They try all kinds of things like talking about “ranges” and saying “the range is within” – but I just keep asking them for actual average temperature.
The other way, is to find a graphic that they don’t like, and each time they ask a dumb question to post the graphic as proof of what you are saying. It usually takes quite a time as they are as thick as planks, but eventually they cotton on that all they are doing is filling the forum with images they don’t like – and they shut up.
One of my favorites for the model believers, is to ask them to list all climate forcings (both known and unkown, but get to that later after they start stuttering), rank them by efficacy, and then quantify them.
That usually ends the scientific segment of their responses.
I always ask them what the temperature of the Earth is supposed to be at this precise moment in time, how they know what it’s supposed to be and then ask for all associated data, proofs and reproducible experimental procedures used to determine the “proper” temperature of the planet. Most of them don’t seem to understand that in order to prove it is “too warm” one must know the “right” temperature in order to use that complicated mathematical formula for determining the amount of Mann-kind’s temperature increase… subtracting today’s temp from the “supposed to be” temp. Not one has ever even attempted to do anything after I ask that one… except to insult me, my parents, pets, say that “isn’t science” and then change the subject.
And somehow I thought this Charles person was someone notable like Prince Charles.
I’m afraid Prince Charles wouldn’t even recognize he’s been set up. Charles Johnson may.
I am not sure that he recognizes it.
Please see my comment (off topic) on the North Atlantic in the last thread.
Some of what Steve has produced here is verified.
Mann is still being mocked at WUWT today.
DirkH sums it up concisely at Notrickszone:
Gary Pearse is looking down the road:
http://notrickszone.com/2015/03/24/dead-at-birth-german-warmist-scientists-slap-down-rahmstorfmann-amoc-paper-offers-no-strong-indication
Prince Charlie is an excellent example of why cousins should not keep marrying cousins. That is probably why the Queen wanted him to marry Princess Di. She was the descendant of the House of Stuart (illegitimate and several generations back) on her fathers side but her mother was of very mixed ancestry.
Hopefully the sons are better stock.
Harry is probably not related to his ‘dad’ at all anyways which explains why he stays as far as possible from them all.
Back before he became an idiot he actually helped expose “Rathergate” right before the 2004 election. Funny that the term coined at the time “fake but accurate” describes what the hoaxers are trying to pull over on the public today.
https://www.youtube.com/watch?v=n-LJ9qLbNJI
Holy smokes!
Does he even understand what he posted?
For sure not when he posted it. By now he probably does. Once upon a time in Little Green Footballs land they could recognize patterns. Two of these things are alike and stuff like that. Also, Charles could recognize fraud and forgery back then:
http://littlegreenfootballs.com/article/12526_Bush_Guard_Documents-_Forged
http://littlegreenfootballs.com/article/12615_The_Smoking_Memo
Then something happened. Nobody knows what. These days they could replace the temperature record with numbers from Walmart cash register receipts and Charles wouldn’t be any wiser. Sad what happened.
I never followed LGF but an obvious conclusion can be reached from your post, I dont know if its wrong or right, but it would seem that he has a preferred political party and favors there opinion. What were his positions between 1992-2000?
He was on the anti-BS team back then. Then something happened. He started transitioning. Now he’s playing for the other side. Like Bruce Jenner.
http://s1.ibtimes.com/sites/www.ibtimes.com/files/styles/v2_article_large/public/2014/01/31/bruce-jenner_0.jpg
Being of a certain age I can now never look at a box of Wheaties the same.
Thanks alot CW! I guess dinner will have to wait… or… we could go with a palate cleanser…
http://1.bp.blogspot.com/-3kyVlgKvY0s/Tc3rXajYE5I/AAAAAAAAKV0/CBRHHKx_STs/s1600/7.jpg
Your picture and some pickled ginger should do it in no
time … oh, wait, is that how Jenner looked in Montreal?
Did I say bon appétit?
Raquel shows up often around here, and I still have to counter with: http://i.imgur.com/Q8aqYaB.jpg
Is that Tony’s cycling partner?
I always wondered why he moved east. Cycling buddies, eh?
http://www.newworldorderwar.com/wp-content/uploads/2012/05/obama-riding-a-girl-bike.jpg
http://scaredmonkeys.com/wp-content/uploads/2011/05/Obama_tricycle.jpg
Monica Bellucci and I wish she would ride with me.
One Of These Things is Not Like The Other –
Can you work with ‘dates’, Charles Johnson?
https://www.youtube.com/watch?v=ueZ6tvqhk8U
Beat me to it, Jim.
🙂
roflmao! Charles isn’t very bright, is he ! 🙂
He fell for Steve’s set up. He’s smarter than some but cult zealots and born-again leftists don’t apply reason to articles of faith.
Kinda like the alligator that went for the electric eel …
“Just bite me, sucker!”
https://www.youtube.com/watch?v=O5FtE9wKKRI
One reason I am not a fan of seafood. I have never had a cheeseburger attack me (or give me projectiles, simultaneously from both ends).
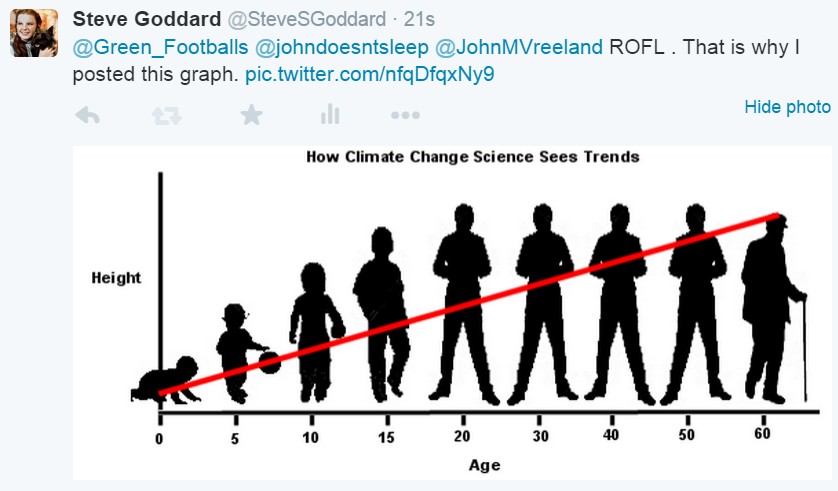
You should post a trend value on your human growth vs time chart to further drive the point home…if 17 inches is the average length of newborns and say 67 inches is the average height for a male, then the trend is a human grows .83 inches per year, every year. Which is complete nonsense.
Why do we not want nicer weather, milder storms a bit more rain and more abundant crops again? My response to warmists is to wish them a hearty ‘good luck’. The current brief interglacial is coming to an end. Temps will drop an average of -6C for 100,000 years.
serious question: do you believe that all these climate scientists that are analyzing the data and coming to the conclusion that this is indeed happening are all in some big conspiracy together? and #2) what would be the purpose for scientists to do this and lastly would not someone that could (peer reviewed) disprove the data make a fortune and become famous?
Not all scientists agree man is responsible for the tiny bit of warming since the LIA. There is no consensus, no 97% agreement, and science is not a democracy anyway.
“No amount of experimentation can ever prove me right; a single experiment can prove me wrong.”
-Albert Einstein
As for your second question, when you pay someone to prove 2+2=5, the only answer you will get is 5. The IPCC was not chartered to investigate the causes of changing climates, they were assigned the task of prosecuting human consumption.
And what do the High Priests of the trillion dollar Climate Change Industry have to say?
“We need to get some broad based support,
to capture the public’s imagination…
So we have to offer up scary scenarios,
make simplified, dramatic statements
and make little mention of any doubts…
Each of us has to decide what the right balance
is between being effective and being honest.”
– Prof. Stephen Schneider,
Stanford Professor of Climatology, lead author of many IPCC reports
~~~~~~~~~~~~~~~~~~~~~~~~~~~~~~~~~~~~~~~~~~~~~~~
“We’ve got to ride this global warming issue.
Even if the theory of global warming is wrong,
we will be doing the right thing in terms of
economic and environmental policy.”
– Timothy Wirth, President of the UN Foundation
~~~~~~~~~~~~~~~~~~~~~~~~~~~~~~~~~~~~~~~~~~~~~~~
“No matter if the science of global warming is all phony…
climate change provides the greatest opportunity to
bring about justice and equality in the world.”
– Christine Stewart, former Canadian Minister of the Environment
~~~~~~~~~~~~~~~~~~~~~~~~~~~~~~~~~~~~~~~~~~~~~~~
“The data doesn’t matter. We’re not basing our recommendations
on the data. We’re basing them on the climate models</b?.”
– Prof. Chris Folland, Hadley Centre for Climate Prediction and Research
~~~~~~~~~~~~~~~~~~~~~~~~~~~~~~~~~~~~~~~~~~~~~~~
“The models are convenient fictions</b?
that provide something very useful.”
– Dr David Frame, climate modeler, Oxford University
~~~~~~~~~~~~~~~~~~~~~~~~~~~~~~~~~~~~~~~~~~~~~~~
“I believe it is appropriate to have an ‘over-representation’ of the facts
on how dangerous it is, as a predicate for opening up the audience.”
– Al Gore,
Climate Change activist
~~~~~~~~~~~~~~~~~~~~~~~~~~~~~~~~~~~~~~~~~~~~~~~
“It doesn’t matter what is true,
it only matters what people believe is true.”
– Paul Watson, co-founder of Greenpeace
~~~~~~~~~~~~~~~~~~~~~~~~~~~~~~~~~~~~~~~~~~~~~~~
<i."The only way to get our society to truly change is to
frighten people with the possibility of a catastrophe.”
– emeritus professor Daniel Botkin
~~~~~~~~~~~~~~~~~~~~~~~~~~~~~~~~~~~~~~~~~~~~~~~
“Effective execution of Agenda 21 will require a profound
reorientation of all human society, unlike anything the world
has ever experienced a major shift in the priorities of both
governments and individuals and an unprecedented
redeployment of human and financial resources. This shift
will demand that a concern for the environmental consequences
of every human action be integrated into individual and
collective decision-making at every level.”
– UN Agenda 21
~~~~~~~~~~~~~~~~~~~~~~~~~~~~~~~~~~~~~~~~~~~~~~~
There are many, many more quotes that illustrate this is a political agenda, and not science.
And all of these scientists (listed by their qualifications) say that the IPCC is FOS…
Atmosphere, Earth, & Environment (3,805)
1. Atmosphere (579)
I) Atmospheric Science (112)
II) Climatology (39)
III) Meteorology (343)
IV) Astronomy (59)
V) Astrophysics (26)
2. Earth (2,240)
I) Earth Science (94)
II) Geochemistry (63)
III) Geology (1,684)
IV) Geophysics (341)
V) Geoscience (36)
VI) Hydrology (22)
3. Environment (986)
I) Environmental Engineering (487)
II) Environmental Science (253)
III) Forestry (163)
IV) Oceanography (83)
Computers & Math (935)
1. Computer Science (242)
2. Math (693)
I) Mathematics (581)
II) Statistics (112)
Physics & Aerospace (5,812)
1. Physics (5,225)
I) Physics (2,365)
II) Nuclear Engineering (223)
III) Mechanical Engineering (2,637)
2. Aerospace Engineering (587)
Chemistry (4,822)
1. Chemistry (3,129)
2. Chemical Engineering (1,693)
Biochemistry, Biology, & Agriculture (2,965)
1. Biochemistry (744)
I) Biochemistry (676)
II) Biophysics (68)
2. Biology (1,438)
I) Biology (1,049)
II) Ecology (76)
III) Entomology (59)
IV) Zoology (149)
V) Animal Science (105)
3. Agriculture (783)
I) Agricultural Science (296)
II) Agricultural Engineering (114)
III) Plant Science (292)
IV) Food Science (81)
Medicine (3,046)
1. Medical Science (719)
2. Medicine (2,327)
General Engineering & General Science (10,102)
1. General Engineering (9,833)
I) Engineering (7,280)
II) Electrical Engineering (2,169)
III) Metallurgy (384)
2. General Science (269)
The 31,0000+ names can be found here..
http://www.petitionproject.org/signers_by_last_name.php.
Is the Catholic Church a conspiracy? Or a group of like minded individuals?
The original 97% consensus is based on a masters thesis. The second question is “Do you think human activity is a significant contributing factor in changing global mean temperatures”? A question most skeptics would answer either yes or possibly to. It is NOT the question: “Do you think there is too much CO2 and it is causing HARNFUL CATASTROPHIC CHANGES.” the news propaganda outlets conflates it with.
10257 Earth Scientists were sent this two minute questionnaire.
Of the 3,146 who responded, 82% of those answered yes to the second question but that wasn’t a good enough ‘consensus’
So they refined that to 77 scientists who had successfully gotten more than half their papers accepted in climate science journals and even then only 75 out of the 77 said yes to the second question.
In graphic form:
https://wattsupwiththat.files.wordpress.com/2012/07/98_percent_climate_scientists_graph.png
What exactly is a ‘climate scientist’? I know what a ‘climatologist’ is, as I was a climatology student.
‘Climate scientist’ sounds to me like ‘water scientist’. It is a way for anyone with a scientific degree to claim expertise outside of their field. A diesel mechanic can write papers on 19th century French Impressionists, but it doesn’t make him an expert on the subject.
Every time I hear, the term ‘climate scientist’, I hear someone with something to hide.
Yes it is how Gavin Schmidt a guy with a degree in mathematics becomes a ‘Climate Scientist’ or how David Suzuki or Al Gore become experts.
Awesome, brilliant, how wonderful.. I can now leave work with a smile on my face. 🙂 I bet ‘Little Green Footballs’ has now got a ‘Little Green Face.’
They never realize the graph shows about 1 deg C per century.
It should be plotted on a scale to 2080 and between at least +- 2 deg C if not 5 deg C (what Nasa predicted in the late 80s). That is part of the problem.
Here is a graph (to year 2000 on right) that has been BURIED by the Alarmists.
https://wattsupwiththat.files.wordpress.com/2012/06/ld2_1kyr11.png
That sure as heck doesn’t look like warming to me.
yea but greenland is losing 200 gigatons of ice every year, and the gulf stream is stopping, and hurricanes are horrible, and the wild fires and the tornadoes, don’t you understand we are doomed with a whole lot of gloom
😉 you left out, “Think of the children!”
And the grandchildren !
What a buffoon. It’s shocking to think that so many of his co-conspirators can’t read a simple graph, like the blink chart you posted showing how GISS has radically altered the temperature records over the last 30 years.
These guys want to debate climate science without even understanding the basic concepts being discussed. Intellectual laziness coupled with irrational hubris is never a good combination.
When he shows the satellite record that starts in 1980, does he know that’s after the cooling 60’s-70’s? If he does, he’s not a buffoon, he’s much worse.
He’s the shrewdest rock in the box of dumb rocks. Just smart enough to try and pull something, but he’s still a rock in the box.
He probably got the graph from SkS or some other primary disinfo site.
Excellent Tony!. Charles still won’t get it. Purposefully.
Perhaps another candidate graph for some GIF work…
http://www.maxworkouts.com/images/uploads/lp/human-aging-process-male.jpg
This is depressing…..
Not as depressing as this….
https://i2.wp.com/missionsharingknowledge.com/wp-content/uploads/2014/04/decline-of-ideology.jpg
What is the source of LGF’s graph? What is TLT? The two satellite records I am familiar with is RSS and UAH
Offah! Reading that made my hair hurt. Going to have to bookmark that site and digest it mentally later…
fun comments
great pics
‘one goes to heaven for the weather, hell for the company’
one of the main reasons I became a denier
http://www.woodfortrees.org/graph/rss/from:2009.083/plot/rss/from:2009.083/trend
Global temperature trend since Barack Obama swore to uphold the Constitution.
I don’t know yet. Looking at Steve’s chart it does not look like the height measurements of the man during his 30s and 40s were homogenized or if the measurements were taken in the evening or in the morning(perhaps before even getting out of bed). I think we should wait to see the trend in the height chart after the data has been quality controlled.
Paul, I sense the hesitation of a knowledgeable and conscientious researcher so just for clarification:
Steve’s chart refers to man’s height [Swedish: höjd, Old Norse: hæð], not to his length [Swedish: längd, Old Norse: lengd].
I know that the Icelandic lengd can refer to either length or height in English.
I don’t speak Swedish and I don’t know the people well but I assume that height, unlike length, of Swedish men doesn’t vary widely during a 24-hour period.
———-
Icelandic:
lengd f (genitive singular lengdar, nominative plural lengdir)
1.(of an area or space) length
2.height
3.(time) length
4.(mathematics) a modulus; (The absolute value of a complex number)
Colorado Wellington March 26, 2015 at 6:20 am,
This NYC born and raised man living in Sweden certainly does not need a Scandinavian lesson by an individual that is not fluent in the various Scandinavian languages and dialects. Although I thank you for your offer of help and commentary.
It is my belief that if the same business practices we see in temperature were applied to height over lifetime the ‘pause’ in height increase would disappear and even the annoying pubescent ‘blip’ in height would cease to exist.
If the same practices were applied to measuring height we might see some measuring stations with lines of men stepping into ditches to be measured…
If the same practices were applied to measuring height we might see that the most alarming trend in height increase is from areas with no measuring stations…
If the same practices were applied to measuring height we might see numerous, interesting and humorous explanations of why the developed algorithm automatically corrected height in one area because it did not fit the obvious growth paradigm assumptions.
If you like Mann, Rahmstorf and the faithful of Global Warming fear the reality of the movie ‘The Day after Tomorrow’ after reviewing their recent Atlantic ‘Conveyor Belt’ Slowing paper then you may after reviewing Steve’s NCDC/NASA homogenized & quality controlled chart have fears in your heart with reflections of the movie ‘The Attack of the 100 Foot Woman’.
How about before being tortured on a medieval rack and after being racked? 🙂
Sorry, Paul, I have to run again this morning. Moving into another Morano safe house.
Please check my other comments before responding. I’m in great distress:
https://stevengoddard.wordpress.com/2015/03/25/global-warming-makes-air-opaque/#comment-509119
Boulder schoolchildren have spring break & they are manning the roadblocks. Unlike Steve I don’t drive a Prius so I am not sure I’ll be ever heard from again.
I never use /sarc tags. Consider length before even getting out of bed.
You may have been out of NYC too long. Sorry again. I said I don’t speak Swedish. Or Swiss. No offense intended.
I’ll dial in and report if I make it.
Colorado Wellington out.
I seem to recall that the satellites must be calibrated, and that the calibration is done using surface data.
What is really looks like to me is one basically flat trend prior to the mid to late 90’s, followed by another basically flat trend (So far at least, fingers crossed while nervously eyeballing sunspot trend chart) a little higher after the mid to late 90’s.
I seem to recall that sometime right around that time, liquid in glass thermometers where replaced with the ones they are using now.
Could it be that this stepped pattern is an artifact of the switch?
Of course the standout event on the whole chart of satellite data is 1998, when we had that super el nino.
So, evidently, one single el nino left a larger fingerprint on the earth’s temperature regime that all the CO2 in China.
Is this not evidence that natural effects predominate. All by itself?
Something like this then Menicholas: http://www.woodfortrees.org/graph/rss/plot/rss/to:1990/trend/plot/rss/from:1997/trend
I skipped the Dec 1991 Pinatubo volcano and the 1998 super el nino though I kept the smaller 1980 mt st helens eruption
Nice.
I love that site.
Offah! Reading that made my hair hurt. Going to have to bookmark that site and digest it mentally later…
Mr. Newark,
(or may I call you hell?)
Sorry about your hair. But, can you tell me what “offah” means?
All I could find was a baby boy name, or a produce wholesaler in Egypt.
Sorry.. the reply above was misdirected. It was meant as a reply to a comment above this one. “Offah” aka “Oofa!” Sound some people make when reading or seeing something rather overwhelming.
In the early ’90s things cooled a bit also because of the VEI 6 eruption of Pinatubo in the Philippines.
From somebody generally more qualified than myself on climate and weather satellites:
http://www.drroyspencer.com/2010/01/how-the-uah-global-temperatures-are-produced/
Opening paragraph:
How the UAH Global Temperatures Are Produced
January 6th, 2010 by Roy W. Spencer, Ph. D.
I am still receiving questions about the method by which the satellite microwave measurements are calibrated to get atmospheric temperatures. The confusion seems to have arisen because Christopher Monckton has claimed that our satellite data must be tied to the surface thermometer data, and after Climategate (as well all know) those traditional measurements have become suspect. So, time for a little tutorial.
See the section titled: “HOW THE DATA ARE CALIBRATED TO TEMPERATURES”, parts excerpted below for expediency.
… and which says, for starters: Once every Earth scan, the radiometer antenna looks at a “warm calibration target” inside the instrument whose temperature is continuously monitored with several platinum resistance thermometers (PRTs).
And secondly: A second calibration point is needed, at the cold end of the temperature scale. For that, the radiometer antenna is pointed at the cosmic background, which is assumed to radiate at 2.7 Kelvin degrees. These two calibration points are then used to interpolate to the Earth-viewing measurements, which then provides the calibrated “brightness temperatures”.
I really couldn’t find where any mention of the surface temperature was used in any way to calibrate the sensor (the AMSU) aboard the satellite …
.
JIm,
Perhaps it was Monckton. I shall bone up on Dr. Spencer’s articles on this.
TY for the link.
BTW, my hair feels fine.
You wouldn’t have to, though. You can pretty easily compare old readings to new readings without having it need to correspond to some surface measurement. The top of the troposphere’s relative temperature should give you a far better idea of whether the whole dang Earth is warming or not, compared with some non-randomly-located thermometers being smeared over 1200km.
Mr. Dickflussig, (Sorry, my keyboard does not have any umlauts)
I have wondered about another aspect of the satellite readings, that being exactly what the sensors are measuring?
Most of what I have read seems to indicate that they give a measurement of the total heat content of the atmosphere at each point on the globe. I am not sure how, or if this is in fact no big trick to accomplish.
I of course agree that the surface “data” is all but worthless, given all the details of what is actually represented in the numbers they give.
But are you saying that these satellite sensor devices have no need for periodic recalibration?
I thought that, at a minimum, they had to somehow account for variations in altitude and such.
I am asking because I do not know.
BTW, even knowing nothing else, the fact that the satellite data is not only ignored, but actively disparaged by the warmistas (but only since the satellites stopped giving warmer temps than the surface measurements), gives it a lot of weight in my book.
ALT [129]
Menicholas says March 26, 2015 at 2:14 am:
Mr. Dickflussig, (Sorry, my keyboard does not have any umlauts)
I have wondered about another aspect of the satellite readings, that being exactly what the sensors are measuring?
This is going to, quite literally, then, ‘blow your mind’: The satellites, for measuring temperature, actually ‘sense’ or measure the intensity of microwave energy at various pre-determined frequencies. The ‘sensor is named MSU or AMSU for “Advanced Microwave Sounding Unit” for a reason. Various atmospheric gases (such as O2) ‘radiate’ well-known amounts of energy in the RF (radio frequency) spectrum and this correlates to temperature.
No joke.
Please don’t be offended in the manner I used to answer this question.
BTW, I should say that measuring, characterizing and generating microwave energy (as used in radio base station infrastructure and RADAR equipment) is my bailiwick …
” But are you saying that these satellite sensor devices have no need for periodic recalibration? ”
They are, effectively, ‘calibrated’ every time the MSU (or AMSU) performs a scan and ‘measures’ temperature. I posted this info just a awhile ago above, at this link:
https://stevengoddard.wordpress.com/2015/03/25/charles-takes-the-bait/#comment-509274
Dr Roy Spencer’s article I linked to above would also seem to answer your other questions. You really ought to to take the time to read it.
Streetcred: Thanks, but it does not seems to work for me.
On this comment box, nothing happens.
In WordPad, I just get a mysterious tone that usually means “What are you doing, do not do that”.
_Jim:
“Please don’t be offended in the manner I used to answer this question.”
No worries.
As to the RF frequencies, I did not know that, so thank you. I am learning.
I suspected it could not be measuring either total EM or IR energy emissions.
But there is a further question: The values are represented as giving the total heat content of the atmosphere. There are of course many layers at various temperatures, and some are more or less dense and hence a given temperature reading could be more or less total energy content of that layer. What keeps a warm layer from blinding the sensor to cooler but denser layers beneath?
I will read up as you suggest.
By way of explanation, I have only recently begun to visit this and other climate sites.
I had, for several years, been an observer and participant in the debate (funny how a topic in which the debate is over is nonetheless one of the most discussed and contentious topics in the entire world), but had become weary and sick of it, seeing every conversation had devolved into a name calling contest and insult fest in which little information was exchanged, and absolutely no minds were ever changed. But I was, at that time, unaware of sites such as this one and others in which actual conversations were occurring.
And thank you again.
BTW, luckily, my brain did not ‘splode!
Yet…
Just leave them to their SKS graphs. Those are tuned for non-thinkers.
I think it’s the pretty colours.
Apparently the watermelons are red/green colour-blind.
Sophistry n.
http://www.woodfortrees.org/graph/uah/from:1980/compress:60/plot/rss/from:1979/compress:48
Lol, a graph from satellite, full of fluctuations in open space, AAAHAHAHAH…