Thinking small, eh? I mean, let’s be honest: by the time you’ve had a few hundred “massages” & carefully sampled, tested, & compared a couple of pounds of Peruvian Marching Powder, you’re trying to make do on less than $100K/yr. Barely enough to cover Sandra Fluke’s condoms for a month.
Colorado
Regarding our comments on Atlantic current slowing down, another Steve at Climate audit shows that it is much worse that that.
The duo actually use the same discredited proxies that are in the hockey stick to try to prove their point. Absolutely absurd!!!!!
Mann must need some money for his trial which I do not think is going well.
I would like to see him on a street corner with a cup in his hand.
He is as much of a narcissistic child as our prez. They’re actions show that neither has a concern for the citizens of the U.S. or the world. Well, maybe with the exception of Iran.
and well …..maybe Russia.
“It’s hard to understand why anyone would seriously believe (let alone publish in peer reviewed literature) that Atlantic ocean currents could be reconstructed by such dreck, but Rahmstorf et al 2015 stands as evidence to the contrary.”
Steve McIntyre
You are right, Darryl, everyone should read that. The reserved Canadian reaches into the German/Yiddish vocabulary to describe the Rahmstorf /Mann paper and after a couple of devastating paragraphs ends with:
Only one thing can be surmised from Rahmstorf and Mann’s claim …
…
… one can probably “reconstruct” almost anything. Are you interested in “reconstructing” the medieval Dow Jones Index? Or medieval NFL attendance?
well, the problem is those results are from actual data and not properly calibrated with the satellite record, which can be used to properly fill in the past 2500 years of drought estimation by extrapolating the rate of drought from the past 5 years of records.
It must be the post-1492 blip where Europeans took what was a pristine desert wonderland and turned it into a thin, rotten wetland. I would wager that 97% of scientists who are also members of La Raza agree with this interpretation.
I just wish some smart person had taken the time to figure out how to move water from one location to another. Perhaps humans will evolve into ultra-powerful wizards who can create water from tubes made of concrete & steel within the next billion years or so. *crosses fingers*
At the current (earlier today) rates of flow of the Mississippi River at Memphis, it would take less than 120 hours of Mississippi flow to fill the top 15 or so major reservoirs in California to max capacity. Amazing what 1.2 million cubic feet per second can do…
Yeah, move water across the San Andreas fault line…until it fails. This is how the Salton Sea was created when an earthquake caused LA water to end up there instead.
Well, technically most of the CA reservoirs are east of the San Andreas–BUT to your point, there are plenty of other faultlines and obstacles with which to contend. (“And whose fault is that, Andreas? I blame you and your SUV…” 😉 ) I was just commenting on the massive gap between supply in one place and demand in another.
Emsnews–?? I have no idea what your point is or why you seem to be seeking conflict. I am talking about storage, not the great Colorado River. I an not talking consumption, but merely stating that the major RESERVOIRS in Calif could be filled in 120 hrs of Mississippi flow. I am not talking irrigation by the flowing Colorado, which is obviously a lifesaver for SoCal and more. Think Lake Shasta; San Pedro Reservoir; Lake Oroville; all the reservoirs east of the San Andreas Fault. I don’t see any disagreement warranted!
Apologies emsnews–I see where the disconnect was. You are exactly right, a ton of CA’s ‘storage’ comes from the Colorado, as you mentioned and in the way you described. I was only talking about the reservoirs wholly within California’s borders. Sorry for the misunderstanding. Now I’m going back to praying for rain… 🙂
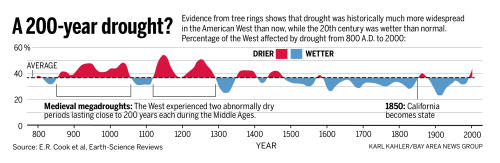
It looks like Californians have been DARN LUCKY for the past ~ 200 years.
If you look at the trend of the long term curve the Southwest is getting wetter. What does that mean?
…. the vegetation cover that existed 500 years ago as Europeans began to arrive in the Americas. In the eastern USA, forest was predominant with warmth-adapted temperate forest in the south-east. To the west, decreased rainfall and the resulting fires prevented trees from growing, and a wide grassland belt (prairie) existed. In the mountains and plains of the far west, sparse rainfall gave semi-desert, open scrub and open conifer woodlands. To the north, various conifer forest belts extended across Canada, opening out into the meadow-like tundra where climates were too cold for trees to grow…..
At the most extreme stage of the last glaciation, most of Canada and much of the northern USA were covered by an ice sheet thousands of metres in thickness. Colder and often drier than present conditions predominated across most of the USA. The eastern deciduous and conifer forests were replaced by more open conifer woodlands with cooler-climate species of pines and a large component of spruce. The open spruce woodland and parkland extended somewhat further west than present, into what is now the prairie zone. As a result of aridity and lowering of sea level (which lowered inland water tables), much of Florida was covered by drifting sand dunes. Notably moister than present conditions occurred across much of the south-west, with open conifer woodlands and scrub common in areas that are now semi-desert….. http://www.esd.ornl.gov/projects/qen/nercNORTHAMERICA.html
HMMMmmm That seems to indicate a wetter south-west means a cooler earth….
My guess… those Christian Crusades made it too dry and is responsible for the last peak in the Medieval Megadrought. Those evil, Bible clinging Jesus lovers are not only terrorists they changed the climate. I know that’s right ’cause Dear Leader Barak the Oneth said that violent sword and gun totin’ Christians hating on peaceful Muslims is why Global Climate Boo-Boos keep it from raining in the deserts… and the rest of it’s ’cause of the Jews, that grandstanding Netanyahu guy and I think Sarah Palin’s still involved somehow ’cause of all the snow this year. You can’t trust them Alaskans when it comes to heat.
Do I win a prize? I mean, I get a “Participation Award” don’t I?
Do I win a prize? I mean, I get a “Participation Award” don’t I?
Yes, Niel, you get 3 Participation Awards, one each for Christian Crusaders, the Jews and Sarah Palin.
You also won a trip to the 2015 Climate Change Summer Camp hosted this year either in Ramallah or Beirut and organized by the Heinrich-Böll-Stiftung Foundation (HBS).
The focus of the 2015 camp is on Gender-Responsive Climate Change Adaptation.
Congratulations again, Niel, but you didn’t get the correct answer. The climate was cooled by Genghis Khan:
Stanford, CA — Genghis Khan and his Mongol hordes had an impact on the global carbon cycle as big as today’s annual demand for gasoline. The Black Death, on the other hand, came and went too quickly for it to cause much of a blip in the global carbon budget. Dwarfing both of these events, however, has been the historical trend towards increasing deforestation, which over centuries has released vast amounts of carbon dioxide into the atmosphere, as crop and pasture lands expanded to feed growing human populations. Even Genghis Kahn couldn’t stop it for long.
“It’s a common misconception that the human impact on climate began with the large-scale burning of coal and oil in the industrial era,” says Julia Pongratz of the Carnegie Institution’s Department of Global Ecology, lead author of a new study on the impact of historical events on global climate published in the January 20, 2011, online issue of The Holocene. “Actually, humans started to influence the environment thousands of years ago by changing the vegetation cover of the Earth‘s landscapes when we cleared forests for agriculture.”
…
“We found that during the short events such as the Black Death and the Ming Dynasty collapse, the forest re-growth wasn’t enough to overcome the emissions from decaying material in the soil,” says Pongratz. “But during the longer-lasting ones like the Mongol invasion and the conquest of the Americas there was enough time for the forests to re-grow and absorb significant amounts of carbon.”
…
Pongratz points out the relevance of the study to current climate issues. “Today about a quarter of the net primary production on the Earth’s land surface is used by humans in some way, mostly through agriculture,” she says. “So there is a large potential for our land-use choices to alter the global carbon cycle. In the past we have had a substantial impact on global climate and the carbon cycle, but it was all unintentional. Based on the knowledge we have gained from the past, we are now in a position to make land-use decisions that will diminish our impact on climate and the carbon cycle. We cannot ignore the knowledge we have gained.”
“My SUV caused the drought between 1200 – 1300. How about yours?”
Mine is saving mankind. If it were not for my SUV we would be in a full on ice age with famine, death, and starvation. Please send more money for my fuel bills.
Is it the one which looks bigger than it really is because there is a spot of tomato sauce on my screen from when I sneezed while eating pizza last night?
Fig. 3. Comparison of the tuned-chronology Castor Lake grayscale record
with tree-ring reconstructions of the PDSI and PDO. Grayscale record (black
line) compared to (A) PDSI grid point #43 reconstruction by Cook et al. (9)
with y-axis reversed, such that increasing aridity is shown as upward
trends (orange) (B) McDonald and Case (19) PDO reconstruction (green),
(C) Gedalof and Smith (17) PDO reconstruction (blue). All data were 20-yr
low-pass filtered to improve visualization (SI Materials and Methods).
(D) The contrasting hydroclimate of the Pacific NW with the desert Southwest
is illustrated by the map generated from the correlation of grid point
#43 in the PNW with other grid points from the tree-ring-based reconstruction
of the PDSI (9), which shows opposite patterns of aridity in the two
regions based on data for the period between 1645–1900 A.D. Locations
of field sites for North American PDO reconstructions are indicated (see
map legend), as well as PDSI grid points, and the location of Castor Lake.
Mid – 500’s show a spike in drought. Is that the reason they thought hiding on a swamp island would be good place to build a city?
When the Lombards invade Italy, in 568, one of the first cities in their path is Aquileia – a Christian town of long-standing importance, traditionally held to have been founded by St Mark. Many of its inhabitants, alarmed at the prospects of life under the rule of Germanic tribesmen, opt for the uncertain status of refugees. Fleeing southwards, some seek safety on a low-lying offshore island – probably occupied at the time only by a fishing community.
The island is Torcello. And the refugees, seen with the hindsight of history, are the founders of Venice.
On the blip spotting front, I’ll have to ask those boys down at the Exeter super-computer centre if they can spare me some time to use their monster, I’ll apply to the EU for some funding and tell them I can solve the water crisis in the UK………oops – the Met Office told us – more big stormy wet wetty…………….. sorry to rain on your parade boys – guess it’s back to the dryas.
“Climate experts are 99% certain that one of the blips in this graph is your fault. Can you spot which one?”
Too easy. The blip that is mankind’s fault is the one that brings in the most grant money, gets the most speaker’s fees, and brings in the most invitations to conferences in exotic places.
Evidence indicating Anasazi cannibalism is so dramatic that I propose it be accepted and the underlying causes and effects put into a balanced cultural and environmental interpretation of that era. Further studies into the basic role of anemia in North America pre-Columbian cannibalism are warranted and indeed, absolutely necessary to achieve a basic understanding of the dietary challenges faced by the many diverse Native American cultures that participated in cannibalism…..
It has been demonstrated that the Anasazi survived numerous droughts, and I believe their long term storage capacity in the system of silo/kivas may also have cushioned them in such a way as they could have survived the great drought as well. They certainly could have returned after the great drought, which they did not. I propose that it was a near extinction of large game animals throughout the region and the rarity of smaller game that made it virtually impossible for the Anasazi to reestablish their culture in the San Juan Basin. The large game animals may take hundreds of years to repopulate their former ranges preventing the Anasazi from returning after the drought. I further point out that there were previous abandonments in the San Juan Basin and that brief periods of re-population were possible for a short period of time…..


Can I have a million dollar grant to figure it out? I promise results, and a consensus, for double that.
Give me a piece of that consensus…
Thinking small, eh? I mean, let’s be honest: by the time you’ve had a few hundred “massages” & carefully sampled, tested, & compared a couple of pounds of Peruvian Marching Powder, you’re trying to make do on less than $100K/yr. Barely enough to cover Sandra Fluke’s condoms for a month.
Is it the one that looks like a dead fly on my screen – wait! It is a dead fly!
I don’t thinks so. Flies are too big.
http://commons.wikimedia.org/wiki/File:Red_Dragonfly-anisoptera.jpg
I bet it’s one of these:
http://www.familytreetreeandturf.com/ftimages/clovermite.jpg
Colorado
Regarding our comments on Atlantic current slowing down, another Steve at Climate audit shows that it is much worse that that.
The duo actually use the same discredited proxies that are in the hockey stick to try to prove their point. Absolutely absurd!!!!!
Mann must need some money for his trial which I do not think is going well.
I would like to see him on a street corner with a cup in his hand.
He is as much of a narcissistic child as our prez. They’re actions show that neither has a concern for the citizens of the U.S. or the world. Well, maybe with the exception of Iran.
and well …..maybe Russia.
I recommend the latest Climate Audit thread for all readers.
They let the Chicoms off too… It’s not about race… it’s just about being Anti-American.
You are right, Darryl, everyone should read that. The reserved Canadian reaches into the German/Yiddish vocabulary to describe the Rahmstorf /Mann paper and after a couple of devastating paragraphs ends with:
Fore me, there is only one question left: How low will they go?
No, there is one more: How can anyone with a functioning brain still defend such drek?
So that’s what a right red uptick looks like. 😀
Are you sure? From the looks of it, it might be a downtick.
I just read yours after posting mine. Similar sense of humour I reckon.
Maybe I should change my handle to Irish Skeptic.
Plz cancel my subscription – there are way too many emailed posts to me.
Thx
well, the problem is those results are from actual data and not properly calibrated with the satellite record, which can be used to properly fill in the past 2500 years of drought estimation by extrapolating the rate of drought from the past 5 years of records.
It must be the post-1492 blip where Europeans took what was a pristine desert wonderland and turned it into a thin, rotten wetland. I would wager that 97% of scientists who are also members of La Raza agree with this interpretation.
Drought is not climate. Drought is weather. Desert is climate. California is a desert, and you can’t have a drought in a desert.
I just wish some smart person had taken the time to figure out how to move water from one location to another. Perhaps humans will evolve into ultra-powerful wizards who can create water from tubes made of concrete & steel within the next billion years or so. *crosses fingers*
Mickey Mann and Ramshead will just tell you that the water will stop flowing in the right direction due to global warming anyway, so why bother? 🙂
At the current (earlier today) rates of flow of the Mississippi River at Memphis, it would take less than 120 hours of Mississippi flow to fill the top 15 or so major reservoirs in California to max capacity. Amazing what 1.2 million cubic feet per second can do…
Yeah, move water across the San Andreas fault line…until it fails. This is how the Salton Sea was created when an earthquake caused LA water to end up there instead.
Well, technically most of the CA reservoirs are east of the San Andreas–BUT to your point, there are plenty of other faultlines and obstacles with which to contend. (“And whose fault is that, Andreas? I blame you and your SUV…” 😉 ) I was just commenting on the massive gap between supply in one place and demand in another.
Very interesting history of the Salton Sea (which is as you said right on the San Andreas) http://en.m.wikipedia.org/wiki/Salton_Sea
So, all the Colorado River water sucked down by southern California is not from Arizona’s Hoover Dam??? Wow.
Could have fooled me and I was raised out there. 🙂
Emsnews–?? I have no idea what your point is or why you seem to be seeking conflict. I am talking about storage, not the great Colorado River. I an not talking consumption, but merely stating that the major RESERVOIRS in Calif could be filled in 120 hrs of Mississippi flow. I am not talking irrigation by the flowing Colorado, which is obviously a lifesaver for SoCal and more. Think Lake Shasta; San Pedro Reservoir; Lake Oroville; all the reservoirs east of the San Andreas Fault. I don’t see any disagreement warranted!
Apologies emsnews–I see where the disconnect was. You are exactly right, a ton of CA’s ‘storage’ comes from the Colorado, as you mentioned and in the way you described. I was only talking about the reservoirs wholly within California’s borders. Sorry for the misunderstanding. Now I’m going back to praying for rain… 🙂
It looks like Californians have been DARN LUCKY for the past ~ 200 years.
If you look at the trend of the long term curve the Southwest is getting wetter. What does that mean?
My guess… those Christian Crusades made it too dry and is responsible for the last peak in the Medieval Megadrought. Those evil, Bible clinging Jesus lovers are not only terrorists they changed the climate. I know that’s right ’cause Dear Leader Barak the Oneth said that violent sword and gun totin’ Christians hating on peaceful Muslims is why Global Climate Boo-Boos keep it from raining in the deserts… and the rest of it’s ’cause of the Jews, that grandstanding Netanyahu guy and I think Sarah Palin’s still involved somehow ’cause of all the snow this year. You can’t trust them Alaskans when it comes to heat.
Do I win a prize? I mean, I get a “Participation Award” don’t I?
You get to go up to Alaska and work with Sarah Palin, feeding all the starving polar bears, because the arctic ice is all melted. [ask Big Al Gore]
http://a.disquscdn.com/uploads/mediaembed/images/1356/8225/original.jpg
Yes, Niel, you get 3 Participation Awards, one each for Christian Crusaders, the Jews and Sarah Palin.
You also won a trip to the 2015 Climate Change Summer Camp hosted this year either in Ramallah or Beirut and organized by the Heinrich-Böll-Stiftung Foundation (HBS).
The focus of the 2015 camp is on Gender-Responsive Climate Change Adaptation.
https://coloradowellington.files.wordpress.com/2015/03/woman-in-bedouin-tent.jpg
Woman in Bedouin Tent
HBS is affiliated with the German party Alliance 90/The Greens.
http://www.greenprophet.com/2012/07/summer-camp-climate-change
Congratulations again, Niel, but you didn’t get the correct answer. The climate was cooled by Genghis Khan:
https://www.youtube.com/watch?v=pPa-5vOzaZk
My SUV caused the drought between 1200 – 1300. How about yours?
It was the Viking invasions that caused today’s droughts in California.
“My SUV caused the drought between 1200 – 1300. How about yours?”
Mine is saving mankind. If it were not for my SUV we would be in a full on ice age with famine, death, and starvation. Please send more money for my fuel bills.
My SUV usually causes floods. It only causes droughts when I shift into reverse.
All the water was hiding in either the pine cones or the depths of the volcanoes while the heat has hiding in the ocean.
Is it the one which looks bigger than it really is because there is a spot of tomato sauce on my screen from when I sneezed while eating pizza last night?
Fig. 3. Comparison of the tuned-chronology Castor Lake grayscale record
with tree-ring reconstructions of the PDSI and PDO. Grayscale record (black
line) compared to (A) PDSI grid point #43 reconstruction by Cook et al. (9)
with y-axis reversed, such that increasing aridity is shown as upward
trends (orange) (B) McDonald and Case (19) PDO reconstruction (green),
(C) Gedalof and Smith (17) PDO reconstruction (blue). All data were 20-yr
low-pass filtered to improve visualization (SI Materials and Methods).
(D) The contrasting hydroclimate of the Pacific NW with the desert Southwest
is illustrated by the map generated from the correlation of grid point
#43 in the PNW with other grid points from the tree-ring-based reconstruction
of the PDSI (9), which shows opposite patterns of aridity in the two
regions based on data for the period between 1645–1900 A.D. Locations
of field sites for North American PDO reconstructions are indicated (see
map legend), as well as PDSI grid points, and the location of Castor Lake.
http://westernconsortium.org/Uploads/Drought%20PNW%20PNAS%2020111.pdf
Shows results from Castor Lake, WA.
Mid – 500’s show a spike in drought. Is that the reason they thought hiding on a swamp island would be good place to build a city?
When the Lombards invade Italy, in 568, one of the first cities in their path is Aquileia – a Christian town of long-standing importance, traditionally held to have been founded by St Mark. Many of its inhabitants, alarmed at the prospects of life under the rule of Germanic tribesmen, opt for the uncertain status of refugees. Fleeing southwards, some seek safety on a low-lying offshore island – probably occupied at the time only by a fishing community.
The island is Torcello. And the refugees, seen with the hindsight of history, are the founders of Venice.
Read more: http://www.historyworld.net/wrldhis/PlainTextHistories.asp?historyid=aa43#ixzz3VRFINXZt
Unfair – I was not born in 1850 to help make CALIFONNIA a state – so what other blips are there?
CALIFORNIA
I actually preferred your first spelling.. where could be FONNIA.. 😉
CaliPHONYa
I’m going to guess the time with the largest drought in the last 500+ years. Just a guess.
The satellites measuring the troposphere have detected no rainfall this year at those altitudes.
Obviously I’m joking, but I do wonder how long before someone starts to have to look at things like that
Has Governor Moonbeam seen this graph?
Has his head exploded?
If not then he hasn’t seen the graph.
https://ametia.files.wordpress.com/2012/10/lib-head-explode.jpg
Has his head exploded? How could we tell?
http://i.ytimg.com/vi/8Qt95KUOX_8/maxresdefault.jpg
When I was growing up, it was the last blue one on the right.
Now it’s a tiny one of these…http://www.familytreetreeandturf.com/ftimages/clovermite.jpg
h/t CW above
That is weird. Sometimes when I post a link, the image shows up, and other times it is just the link.
Now it’s a tiny one of these…
http://www.familytreetreeandturf.com/ftimages/clovermite.jpg
h/t CW above
Test with the link on its own line.
interesting graphic Steve, I’m thirsty for more.
On the blip spotting front, I’ll have to ask those boys down at the Exeter super-computer centre if they can spare me some time to use their monster, I’ll apply to the EU for some funding and tell them I can solve the water crisis in the UK………oops – the Met Office told us – more big stormy wet wetty…………….. sorry to rain on your parade boys – guess it’s back to the dryas.
Give me the money – now!
“Climate experts are 99% certain that one of the blips in this graph is your fault. Can you spot which one?”
Too easy. The blip that is mankind’s fault is the one that brings in the most grant money, gets the most speaker’s fees, and brings in the most invitations to conferences in exotic places.
Wait, I can just barely see the size of a climate scientist’s manhood in the anthropogenic part of that chart.
Somehow, without reservoirs and year-round streamflow control, animals and plants survived much worse periods. Maybe today despite these things today.
Anasazi Cannibalism
Reader quiz! What is the least friendly city? Three guesses and the first two don’t count…
http://features.aol.com/video/unfriendliest-city-world-revealed?ncid=webmail6
I will never go back. Sucks to be a Big Crapple inmate.
Congrats Gavin! 😆
Ya, the wee red uptick at the far right, which is obviously somehow much more ominouser than it looks. ):p