
Temperatures in the Arctic are -30C, as NOAA, NASA, NSIDC and the world’s press announce that Arctic sea ice “shrinks to it’s lowest level on record”
How does ice “shrink” at -30C? Meanwhile, Arctic sea ice extent continues to grow past 2005, 2006, 2007 and 2011 levels.

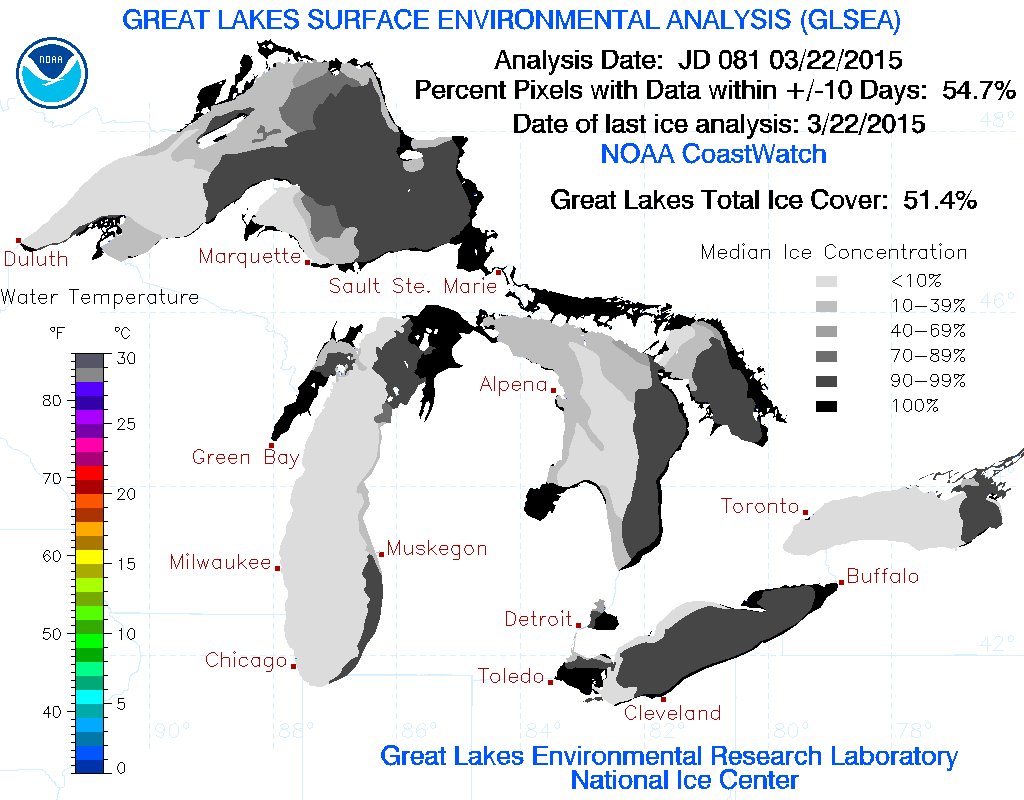
Great Lakes ice cover persists at near record high levels for the date, with more than half of the lakes covered with ice.
We are watching 1984 unveil right before our eyes.

Thanks, Steven, for identifying and announcing the Orwellian world in which we live.
I understand and appreciate the good intentions of environmentalists, but I cannot understand why most climate skeptics fail to understand that AGW is part of future Orwell predicted in “Nineteen Eighty-Four“
It’s global warming Steve. There is only 51% ice on the Great Lakes when last year on this date there was 71%. That’s a 28% decrease in only one year, at this rate the Great Lakes will boil by the end of next century. Give Obama money now to prevent it.
http://www.glerl.noaa.gov/data/ice/imgs/IceCoverAvg1973_2014.jpg
So, for you one year is enough to define a centennial average drift !! Is this “greens’ scam science” or something you just invented?
It is incongruous that there are people who will believe that the Arctic is
meltingnot building as fast as in years past when at the same time the Earths temperature has not changed in about nineteen years. Cognitive dissonance anyone?Temperatures in the Arctic are -30C, as NOAA, NASA, NSIDC and the world’s press announce that their collective IQ “shrank to it’s lowest level on record”
Fixed it!
The Gruberites will look at the temp anomaly map and think it’s 80 degrees in the Arctic. Amazing what a little splash red does for a graphic.
Could someone explain why the Danish curve shows current (March 23) ice extent above 2005, 2006, 2007, and 2011 values and the NSIDC graph shows current ice extent BELOW (outside) the +/- 2 SD range. Am I missing something?
They LIE because Obummer told them to. It is all about the run up to the Paris Conference in December when Obummer hopes to sign a treaty binding the USA to the UN’s plans for a global government — Agenda 21.
This is the ultimate goal:
http://www.postsustainabilityinstitute.org/the-post-sustainable-future.html
More on Agenda 21:
http://green-agenda.com/globalrevolution.html
http://www.infiniteunknown.net/2011/07/27/the-u-n-agenda-21-wildlands-project-…-taking-over-america-starting-with-florida/
http://www.youtube.com/watch?v=QK2sZUs2l_U
Called it a bit early, eh?
It was running on the banner of CNN Intl. over the weekend (I am traveling overseas at the moment).
The follow information may help Gail, gator69, Steven and others decipher the Orwellian influence on science. I recently noticed that Springer continued to publish valid, but unpopular papers after Nature, Science, etc. became channels of consensus dogma:
P. K. Kuroda, “The Oklo phenomenon,” Naturwissenschaften 70, November 1983, Volume 70, Issue 11, pp. 536-539: http://link.springer.com/article/10.1007%2FBF00376669
J. M. Herndon, “Nuclear fission reactors as energy sources for the giant outer planets,” Naturwissenschaften 79, 7-14 (1992): http://link.springer.com/article/10.1007%2FBF01132272
V. A. Kotov, “A pulsar inside the Sun?” Radiophysics and Quantum Electronics 39, 811-814 (1996): http://link.springer.com/article/10.1007%2FBF02120961
O. Manuel, E. Miller, A. Katragada, “Neutron Repulsion Confirmed as Energy Source,” Journal of Fusion Energy, December 2001, Volume 20, Issue 4, pp 197-201: http://link.springer.com/article/10.1023%2FA%3A1023485018692
Oliver K. Manuel, Barry W. Ninham, Stig E. Friberg, “Superfluidity in the Solar Interior: Implications for Solar Eruptions and Climate,” Journal of Fusion Energy December 2002, Volume 21, Issue 3-4, pp 193-198: http://link.springer.com/article/10.1023%2FA%3A1026250731672