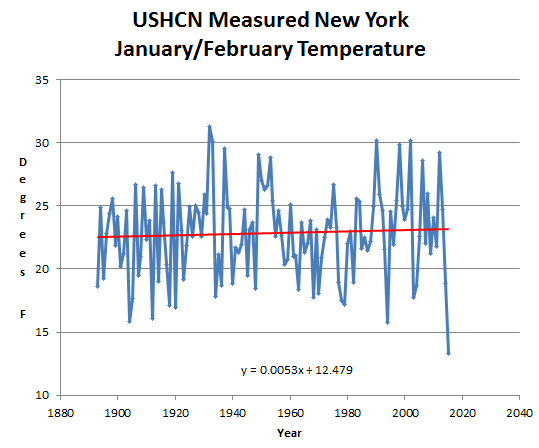
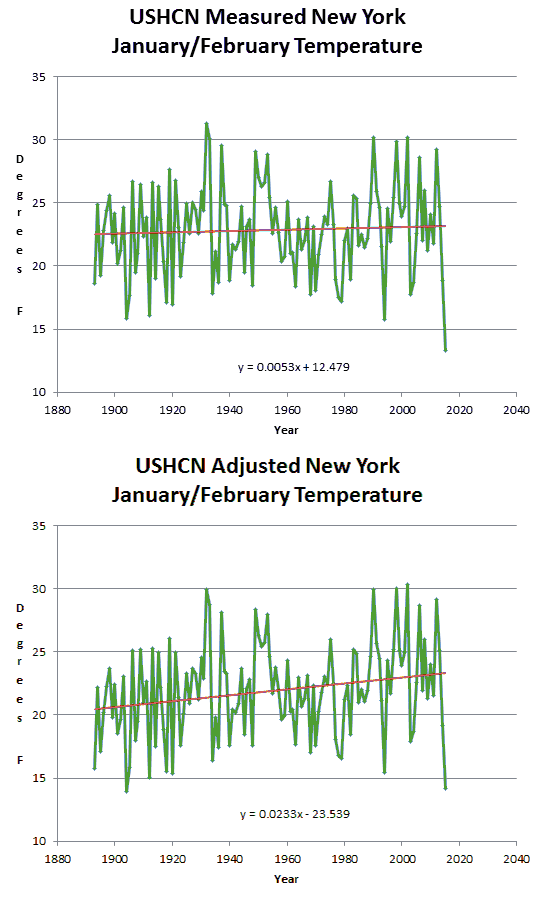
New York state just had their coldest January/February by a wide margin, more than 2.5 degrees F colder than the prior coldest year of 1904.
Based on the USHCN adjusted temperatures, I predict that NCDC will rank 2015 as second coldest, and create a non-existent warming trend of 2.3 degrees per century.
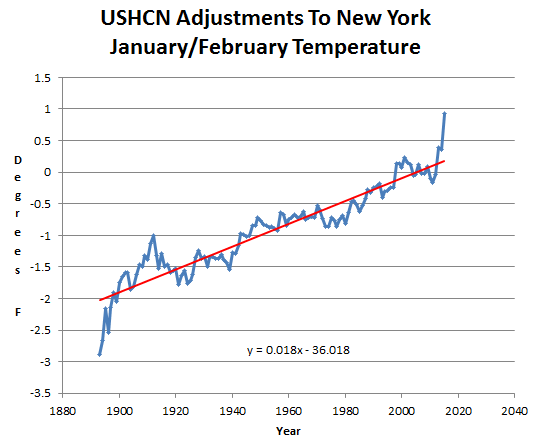
The total data tampering in New York since 1893 is nearly four degrees F, with the current year nearly a full degree above the measured temperature.
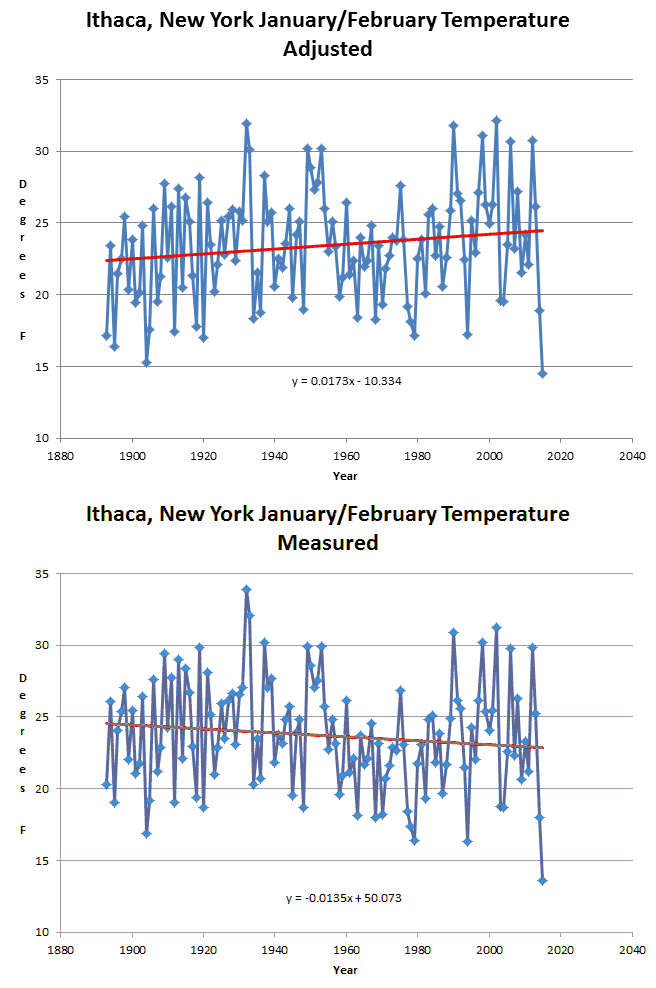
One of the more impressive locations is at Ithaca, where Richard Feynman used to teach.
It doesn’t matter how beautiful your theory is, it doesn’t matter how smart you are. If it doesn’t agree with experiment, it’s wrong.
– Richard P. Feynman
Zeke and Mosher say this is all first rate science.


If Feynman was alive now, they would be calling him a “denier”.
A certain congresstroll would be demanding his financial papers.
They are already claiming this winter was one of the warmest winters evah…again. But outside of LA where even they had snow and ice ON THE BEACH…no one will believe them anymore.
“… LA where even they had snow and ice ON THE BEACH…”
Can you provide a link? or date at least.
Hailstorm on Monday, not really snow and ice. There were photos yesterday. Here’s an account http://www.pressreader.com/usa/los-angeles-times/20150303/281895886702368/TextView
Lots of really dramatic hails storms in the last few years as the Jets goes loopy and the Arctic and Tropical air clash. “This is Mini-Ice-Age/Wild Jet Stream Age stuff,” says astrophysicist Piers Corbyn.
January 2015: Hail delays soccer game in Mexico — 2? inches of hail completely covered the floor of the Hidalgo Stadium.
July 13 2014: Freak summer blizzard and hail hit Siberia, Urals Snowdrifts piled up on the roads as the abnormal summer snowstorm hit the region. Siberia also witnessed a downpour of giant hailstones.
July 23 2014: 15 cm (6 inches) diameter hail damaged crops, power lines and broken glass in homes in the Omsk region of Russia.
July 2014:Hailstones as big as softballs — Three people sustained head injuries on Saturday afternoon near a lake west of Bismarck, North Dakota after a severe storm dropped hailstones as large as softballs.
Three people sustained head injuries on Saturday afternoon near a lake west of Bismarck, North Dakota after a severe storm dropped hailstones as large as softballs.
July 2014: More than a foot (35 cm) of hail in Spain
June 2014: Russia – Hail the size of eggs, along with snow
May 2014: Brazilians trapped by massive hail storm — Up to 20 cm (8 inches) of marble-sized hail reaches the bumpers on their cars.
March 2014: India – Farmers commit suicide after hailstorm destroys crops
March 2014: One meter (3 ft) of hail in Eritrea
H/T Ice Age Now.
What do you think hail is… chopped liver?
So…hail is what? FROZEN WATER. What is snow? The same only softer. Ice doesn’t freeze when it is hot.
You can get hail in the summer because it forms high up near the stratosphere in thunder clouds. It is indicative of the strength of the storm’s vertical winds, the height of the storm clouds and the temperature at the top of the clouds. It does not have much to do with surface temperature.
Rider on The Storm is one of the most dramatic illustrations of the point I am trying to get a cross.
The angle of the data tampering in New York, as shown by the USHCN chart would get a “High Stick” call from any ref in the NHL.
Last year I didn’t plant tomatoes because the cool temps went so far into the season. Then the summer never had one 90 degree or over day. My pool gets full sunlight and was so cold we only went in twice for 15 minutes each. Wasted a lot of chlorine and electric (filter) for nothing. I’ll have to weigh opening the pool this summer. This year I’m afraid I again won’t get to plant tomatoes. It’s March, we still have snow on the ground, we got more snow 2 days ago, and are expecting more 2 days this week.
I miss my heirloom tomatoes.
I am in mid North Carolina. We still had snow on the ground yesterday morning. This week we will have lows of 23° F, 24° F, 30° F The normal low for this time of year is 37 °F.
For the last two summers we had very few days over 90°F.
Ten years ago we had for the first week of March
First week of March 2004 the MIN | MAX. were:
69°F. | 28°F.
71°F. | 53°F.
77°F. | 53°F.
82°F. | 48°F.
78°F. | 59 °F.
73°F. | 62°F.
71°F. | 42°F.
And in April 2004 we had 6 days over 90°F and over. May 2004 had 17 days 90°F and over. In 2013 and 14 we didn’t see that many days over 90°F for the entire summer and we certainly will not see that this year.
New York has the biggest UHI effect in the world. Back in 1890 it was just a small town. If you make a correction for the heating as result of the UHI effect, you would see the temperature trend going down.
Back in 2010, I posted the following analysis on New York City power usage as it related to UHI.
DD More February 26, 2010 at 7:22 am
I could never understand how UHI was minimized. If you look at New York City as an example.
Area, including water 468.9 sq mi ( 2,590,000 sq m)
Power used (2008) 54,869 GW-hr
(http://www.nyc.gov/html/planyc2030/downloads/pdf/progress_2008_energy.pdf)
Watts/sq m = 2,416 total. The Mayor says 80 percent is used by buildings and therefore 100 percent ends up as heat loss. So the forcing is 1,933 W/Sq M
The file also remarks that the city has seen a 23 percent increase in the last 10 years, which is close to the increase showing up in the charts.
http://wattsupwiththat.com/2010/02/26/a-new-paper-comparing-ncdc-rural-and-urban-us-surface-temperature-data/#comment-329553
Well it should be updated a little. Clarifying the 80 percent used by buildings was for lighting and heat, so by next day at the same temperature it was all turned to waste heat. I heard later that Reliability concerns require that 80% of the City’s peak load be met with in-City resources under a mandate from the New York State Reliability Council and the New York Independent System Operator.
The original calculation would now be 54,869 GW-hr / year * 1.0 x 1.00E+09 W/GW x 8760 hr/yr = 6,263,600,000 W-hr / hr. that divided by 2,590,000 m^2 = 2418 W / m^2 each hour. But if you take at least 60 percent of power generated in the city generates 40 percent excess waste heat to convert to electrical power = 2418 x (1+ .24) = 3000 W / m^2 of extra energy being dumped in the air of New York City. And that is from electrical power alone, doesn’t include all the vehicle waste heat.
So does 3,000 w / m^2 raise the temperature more than 100 ppm CO2?
I monitor Heating-Degree Days for my location. Each month, say, Weather Underground publishes the total HDD for a month, the most recent February. On the morning to the 28th, they published 1506 HDD. On the morning of 1 March, February was 1499. I have seen this reduction for a month many times, and WU has not answered my query. Have you any possible explanation? Thanks much.
It’s getting so cold in the early 20th century that it is amazing that our ancestors managed to survive!
If it gets any colder around 1915 my grandfather will have frozen in the trenches of the Great War and my father will never have been born. As to me …