
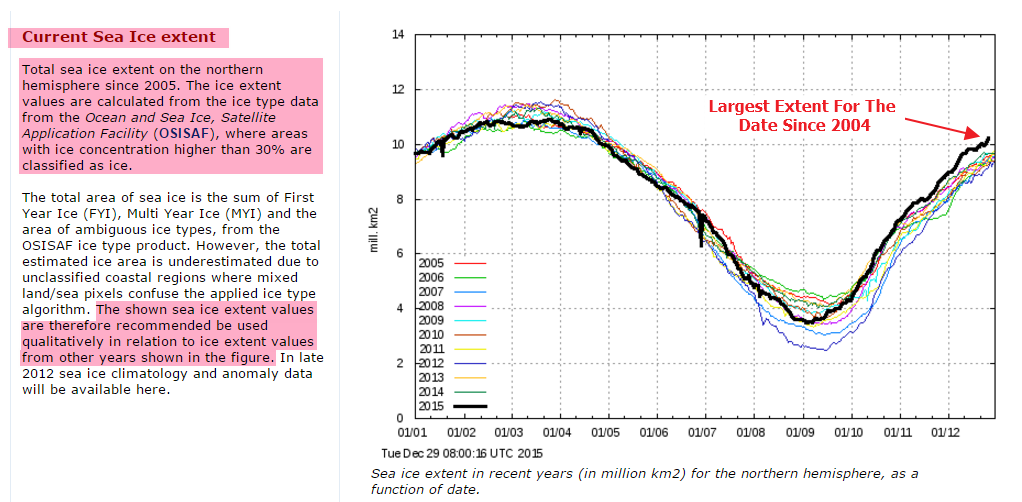
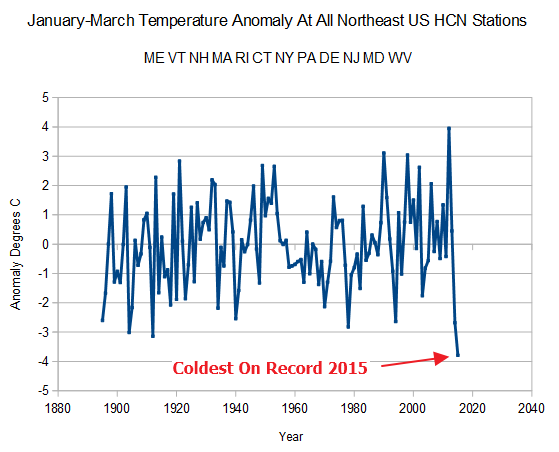
Government climate experts say that 2015 is the hottest year ever. A couple of sure fire clues for this are the highest Arctic sea ice extent in over a decade, and the coldest January-March on record in the Northeast US.
Ocean and Ice Services | Danmarks Meteorologiske Institut
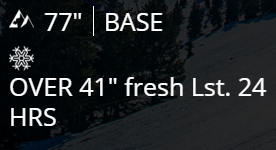
Forty-one inches of snow in 24 hours in southern New Mexico is another dead giveaway of an overheated atmosphere.

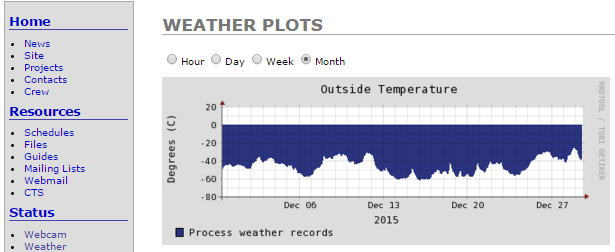
As is the coldest autumn on record on the Greenland ice sheet

Find if suspicious that the DMI came up with a new way to plot the Arctic ice that now include coastal zones.
Did they go back and re-calculate all the other previous years and re-plot them? Reminds me of the Argo and other re-calculations/
There is nothing suspicious about it.
What is interesting about the 30% concentration and above ice extent plot that Tony shows is that if the the current trend holds until this weekend, it will be the first time for all the years plotted that the extent has been ABOVE 10 million km^2 at the start of the new year.
That’s because the graph is borked Frank K. The newer DMI one should be used which shows an extent in line with all the other graphs including the Cryosphere 30% ones.
As DMI replaced this graph with the one without masking they obviously do not monitor it any more as out-dated product and it has gone awol.
Andy
What in the world are you trying to say, Andy?
1. Who “borked” the graph? DMI?
2. The masking out of the coastal regions has nothing to do with year-on-year comparison:
Why would DMI recommend using it qualitatively for comparison to previous years if they knew it was “borked” and “AWOL”?
3. What do you mean by saying “they obviously do not monitor” the graph? How do you know it? Are you suggesting the underlying OSISAF input data is wrong or DMI’s interpretation of it?
4. While this graph is masking out the coastal areas to sidestep the described pixel determination problems, why should we doubt the extent of the “open water” ice? Are you saying the quantified ice extent was right in the earlier years but this year it is not? How do you know that?
What you’re saying doesn’t make sense. If you have some insider insights I would like to hear it but it seems to me you are making stuff up.
Actually you have it backwards… The new way excludes coastal zones.
Hi Colorado
DMI text saying to compare it to previous years was written before the new graph came out, it’s very old, seems to have started in 2005 and then got replace by the new one in 2012 with first year data from 2011. When the new one came out they wrote “the plot above replaces an earlier sea ice extent plot”. I assume their algorithm was improved so they could go down to 15% concentration from 30% and also did not have to mask edges.
They even wrote “The old plot can still be viewed here for a while.” It’s been a loinmg while ….it’s still there, and it’s gone awol…… 🙂
Because of this it is likely they do not spend any time or effort on the old chart, it has hit some problem and they have not corrected it. These things happen from time to time.
I’m saying the ice extent is right before and not now because it is deviating from the other graph and other graphs. This graph should follow the other graph in it’s shape but have lower values. It does for past years but not this year, this year it shows an anomaly from the summer onwards, it followed the other graph in shape before then.
Andy
Hi Dave G,
Nope, new graph is absolute figures
“The plot above replaces an earlier sea ice extent plot, that was based on data with the coastal zones masked out.”
Andy
Forecast polar vortex (about 27 km) shows frost on the east and north Europe.
http://www.cpc.ncep.noaa.gov/products/stratosphere/strat_a_f/gif_files/gfs_t10_nh_f240.png
http://www.cpc.ncep.noaa.gov/products/stratosphere/strat_a_f/gif_files/gfs_z10_nh_f240.png
Temperature above the polar circle low.
http://www.cpc.ncep.noaa.gov/products/stratosphere/strat-trop/gif_files/time_pres_TEMP_MEAN_OND_NH_2015.png
http://ocean.dmi.dk/satellite/plots/satsst.arc.d-00.png
Gee, for the hottest year ever, it sure seemed pretty mild to me. No increase in severe weather, no increase in sea level rise, no climate refugees, no increase in wildfires, and mild conditions around the holidays. So what are we supposed to be worried about?
You are supposed to be worried about the welfare of your grandchildren. The rate of sea level rise is going to double every ten years until it’s going up a millimeter per day by the end of the century. That’s something to worry about.
I worry about the welfare state our grandchildren will “inherit”, and what they will be forced to do in support of it.
CO2 directly controls the sea level….
..you would think the temp would have to change first
🙂
@ Steve case
“The rate of sea level rise is going to double every ten years until it’s going up a millimeter per day by the end of the century. That’s something to worry about.”
365mm/year in just 80 yrs time !! Wow,
at that rate the sea gate at Harlech Castle , should be back to where it was in 1289 in another 500yrs.
The west entrance was a Watergate accessible at all states of the tide, just where the road & rail cross in this picture – http://www.harlech.com/ – the sea is now approx 1 mile away.
Your levels of medication…..That’s something you should worry about.
You left your sarcasm detector de-energized.
Here in Washington, DC, the last two weeks of February and first week of March were the coldest such period ever. On March 7th, the Potomac River was frozen over and totally covered with snow. It had never been frozen over in March during recorded history. Also one of the latest blooming of the cherry blossoms.
True, we are having an exceptionally warm December. But with roses blooming and golf courses green and open for business, it is hard to imagine any downside, unless you think going out without a heavy coat or paying low heating bills is a downside.
It is presently 75F – SWEET!
I have lived at the beach in NC for 20 years and I have not noticed one even little rise in the Sea level yet….so when is this supposed to start?…..
Sir, I would like to know how I can get the raw data from the HCN and make sure it is the not manipulated data and graph it myself to show the histerical Chicken Littles. And can I do it so I don’t get blamed for “tampering” it? I’d appreciate it very much.
Mus, Erzurum, Van and surrounding areas in eastern Turkey face substantial snow as UNSEASONABLY cold air plunges southward from eastern Europe and a pair of storm systems arrive from the Mediterranean Sea.
http://www.accuweather.com/en/weather-news/biggest-snowstorm-so-far-eastern-turkey/54467733
http://www.noodweercentrale.nl/de/wetter/profiwetter/stroemungsfilm/europa.html
Arctic sea ice age is not doing great.
https://www.youtube.com/watch?v=FDRnH48LvhQ
So what? Did you forget that we have two poles? And if you watch your video closely, the Arctic sea ice has rebounded since 2012.
https://www.youtube.com/watch?v=SNxHAaYADP8
Antarctica barely has any multi-year ice. Looks like that’s how the Arcic will be very soon too.
And even if that is true, please provide the list of peer reviewed papers that disprove natural variability as the cause Chicken Little. Enough BS child, no suckers here.
But Antarctic sea is at a much lower latitude so all that ALBEDO business that Al Gore was talking about applies far more to Antarctic sea ice than his Arctic albedo. Looks like all that sea ice in Antarctica reflects sunlight back to space.
You have to be a bit careful about 2012 because it was an unusual year. Same as 2007 was. Better to take a trend.
Andy
OK, I’ll take the trend that says we are currently seeing more ice in the Arctic than the average of the past 9000 years.
The Antarctic sea ice cycles between a minimum of of 4.0 Mkm^2 at latitude 70 south, to a maximum of of 19.5 Mkm^2 at latitude 59.2 south.
The Arctic sea ice only varies between 72 north and 82 north.
On EVERY day of the year, Antarctic sea is exposed to 2 to 5 times the radiation that Arctic sea ice receives, and therefore Antarctic sea ice is 2 to 5 times MORE important to the earth’s heat balance than the Arctic sea ice.
H/T RACookPE1978
“OK, I’ll take the trend that says we are currently seeing more ice in the Arctic than the average of the past 9000 years.”
Can you show me the graph for each year or give me peer reviewed papers showing such?
Andy
Maps HERE
click on the continent you want to look at.
Where’s the graphs I was asking for Gail though? Current Arctic trend graphs are satellite era, so about 35 years. I’d like that sort of granularity shown for the last 9000 years from Gator please as he likes to ask for proof …..
I’m guessing Gator will be found wanting which will show he just came up with an off the cuff remark he could not back up like he asks other people to do :whistle: …
😉
Andy
Sorry to disappoint you Andy, but Gator is never found wanting, and can always back what he says with solid info.
Happy New Year!
Peer reviewed paper…
http://research.bpcrc.osu.edu/geo/publications/mckay_etal_CJES_08.pdf
Here is the peer reviewed paper…
http://research.bpcrc.osu.edu/geo/publications/mckay_etal_CJES_08.pdf
Yeah, I have learned never to tangle with gator…
Gail, with you I prefer to think of our engagements as more of a Tango than a tangle. 😉
I really don’t get this “warmest year ever” garbage… where is the warmest? And don’t say “global” for there is no such thing as a “global temperature” or even an average temperature (averaging temperatures of different climates makes no sense at all). The whole idea is absurd. Regarding real temperature, where is it actually warmer? I live in Michigan and, sure, we are having a warm/wet fall and now start to winter, but this is not “unprecedented” or “record breaking” when you consider the record is less than 200 years. It is beyond absurd to even claim a record was broken when you have no significant record to study and what you do have has been tampered with or is in other ways inaccurate or unreliable. It is all bullshit. The whole argument of “Man Man Global Warming” or “Catastrophic Anthropogenic Climate Change”… it is a joke! And you fell for the joke, I honestly feel sorry for you.
Luke, most of us here think CAGW is a crock of porcine feces.
I certainly agree that averaging temperatures or even using temperatures at all to measure the climate is idiotic. Temperature without a measure of the amount of water vapor in the atmosphere is a rotten measure of the atmospheres energy content.
What signs are there that the recent collapse of Arctic multi/year ice is “natural”? How come this did not happen 100 years ago?
List of papers please.
Oh a skeptic is asking for scientific papers? That’s funny as it looks like the entire skeptic community managed to produce ONE POSTER for AGU 2015, lulz.
You guys have passed the parody-horizon 😀
He’s asking for a list of papers showing Arctic multi-year sea ice 100 years ago. Since there are none, your assertion that the Arctic was not melting 100 years ago is pure bullshit.
Can you produce proof or not? Are you presenting your beliefs as facts, or are you just stupid? Your mocking is simply a poor attempt at cover for your failure to disprove natural variability. Why is the truth so distatseful to you?
AGU???
That is the group that has removed any and all peer-reviewed skeptic papers they had at their website. Why ever would you expect such a biased group to accept any papers that do not fit their CAGW agenda?
cfgjd is asking two questions, so doesn’t need to provide any papers. A statement might need them though. But he/she is not making a claim.
Andy
Wrong. The alarmists make claims that are unsupportable according to the published and peer reviewed literature.
Andy-
Cfgjd made the implicit claim that the multi year Arctic sea ice extent was greater 100 years ago than it is today. His questions are meaningless without that implication. Gator asked for evidence to support that claim, as the questions can’t be answered if the implication is false.
What recent collapse… Volume and area are roughly the same as 10 years ago. Prove me wrong.
Gator said “Wrong. The alarmists make claims that are unsupportable according to the published and peer reviewed literature.”
That might be true but in this case someone asked two questions.
Andy
I don’t care if 4.5 billion questions were asked, alarmists are lying about the science.
“When did you stop beating your wife?” is a question. It can not be answered rationally unless you did, in fact, beat your wife. All questions depend on certain assumptions. If those assumptions are wrong, the question becomes meaningless. Gator is asserting his belief that the assumption conveyed within the questions was false. As such, his request for clarification is the only rational response.
I think it more likely that those who report a recent collapse of Arctic multi/year ice, are mistaken or lying or both. Until it becomes impossible to keep up the pretense, different organizations and people are more and more desperately fudging, adjusting, and lying through teeth, to keep the pretense going just a bit longer. I sincerely hope for the sake of the rest of us, that they do not get what they think they want, before it becomes impossible to deny the current and coming realities.
How come YOU continue to ignore numerous published science papers attesting that there were little to no summer ice in the Arctic earlier in the Holocene?
Let’s see: liberals are for protecting the environment for future generations. That’s so caring! Meanwhile they are bankrupting their children’s future, advocating for the destruction of familial stability, having less children, and support aborting these children at record numbers. What children are they protecting the environment for?
So no skeptic research besides one poster? Folks, it’s obvious the emperor has no clothes.
What are you talking about? Have you taken something again?
So M. Winston Smith complains because I post too much ‘sciency stuff’ and CFool is complaining I do not post enough skeptic research…..
Sometime I really really wish we could gather them all up and dump them all in their No CO2 emission Socialist Utopia and lock the door. (I am sure Putin would be willing to donate some of Siberia.) Unfortunately they ALWAYS want to drag everyone else along with them. This is not surprising of course, because the parasites know they need producers or they might actually have to work.
https://assets.entrepreneur.com/content/16×9/822/20141114193856-reason-castaways-giligan-island.jpeg
WORK!?!
I need to find a short justification of the alarmist resettlement project I wrote a while back and see if it still applies. I thought it made a lot of sense for both sides.
If Putin won’t donate part of Siberia there is the whole continent of Antarctica.
No trolls except for cfgjd? Folks, it’s obvious cfgjd has no clothes on… that’s scary.
No it is YOU who is full of crap since it has been shown numerous times that decreased summer ice in the Arctic has happened many times during the inter glacial period,even to no ice at all.
just left Virginia on Sunday where it was 70F to return to Wisconsin so I could miss a pretty robust snow storm; we got about 8″ + it took me about two hours to clear the driveway. So if you ask me if I would like more CO2 and green trees or more ice + snow you do not even have to wait for the answer.
Heavy snow in New Mexico is a manifestation of the permanent drought.
Reblogged this on Climatism.