
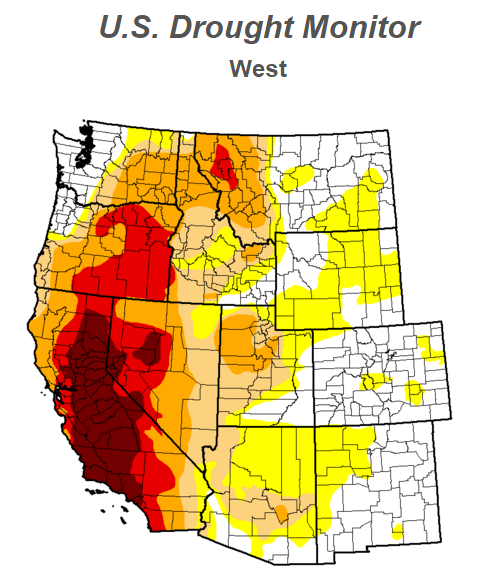
Many sections of the west which have received more than 200% of normal precipitation this year, are listed as “abnormally dry” in the US Drought Monitor
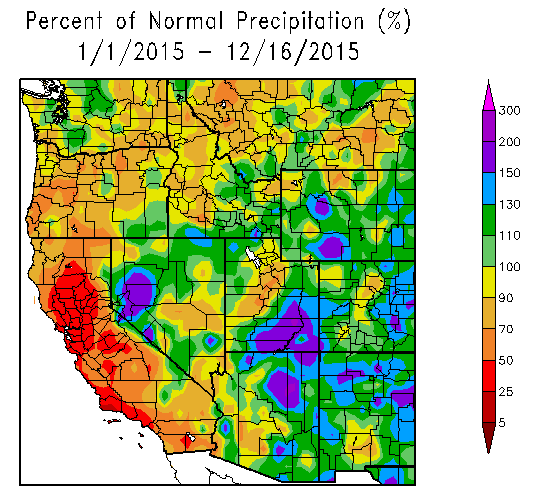
http://hprcc.unl.edu/products/maps/acis/nwswr/YearPNormNWSWR.png
The PMDI is a much more accurate representation of reality than the Washington DC based “US Drought Monitor”
Washington DC – all BS, all the time.

I live in NW Montana and I monitor the precipitation with a weather station I own. We are way above “normal” for 2015. Our “normal” precipitation is ~25 inches per year. March through September (our driest months) I had recorded >16 inches of precipitation. We are on schedule to be more than 10 inches above “normal”. Washington has us listed as extreme drought. What a joke.
We people in Washington, DC know what is best for you, regardless of what your rain guage says! Even if we can’t read our own.
Right. Ignore the man behind the curtain.
Looks like alot of “smoothing” taking place. Excrapolation.
Drought data is known to lag way behind in showing recent precipitation.
And now as you near year end 2015, has the drought reappeared, the water increased or the designation as extreme drought changed?
They have my area as ‘normal’ despite the fact my fungus has mildew. It has been soggy this year and last year.
The last graph is spot on. It has us pegged exactly as it happened this year. Our state (Idaho) suffered devastating fires due to a moderate-severe drought this summer. Wheat yield was at a 25+ low. The first two graphs are not accurate for us.