
With record snow in the west, team climate moron is holding a giant climate prediction circle jerk.
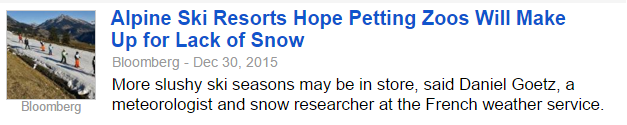
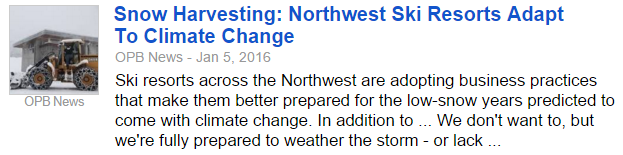
The first thing the Northwest is going to have to adapt to – is sub-zero football this weekend.

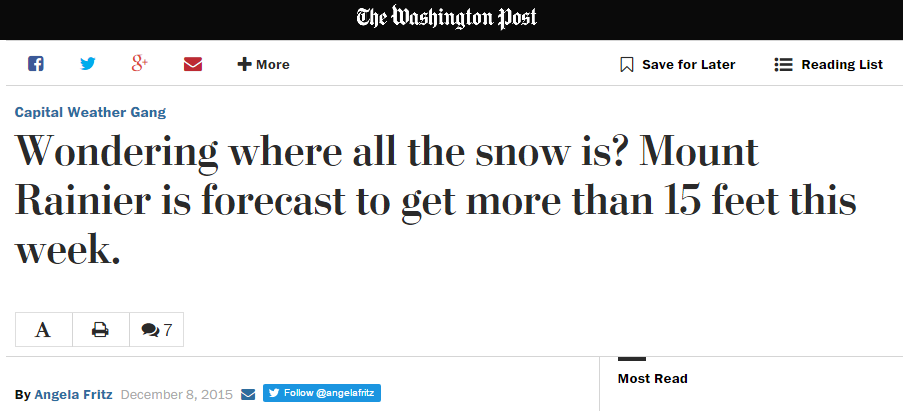
Mt. Rainier is forecast to get another 15 feet of snow this week.
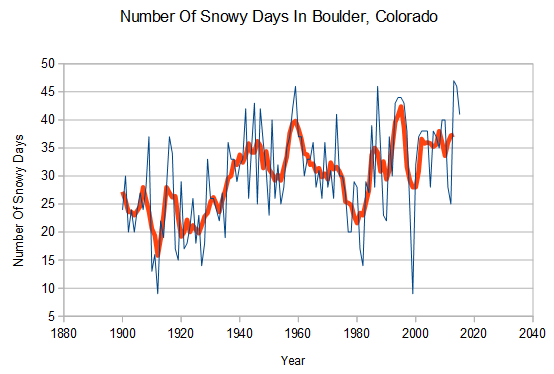
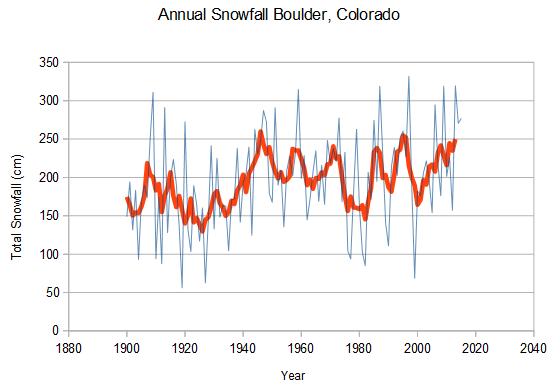
Snowfall in Boulder, Colorado has been increasing in frequency and depth for century. The last three years have brought snow more often than one day out of every ten. February 2015 was the snowiest month on record in Boulder.
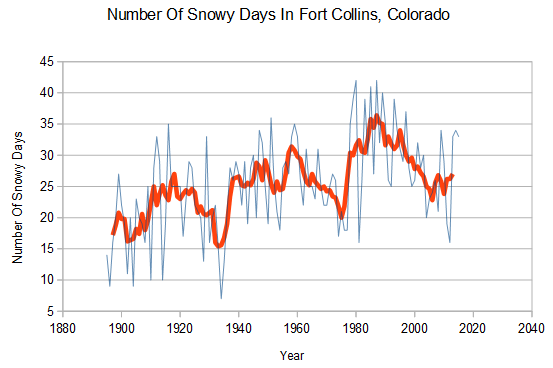
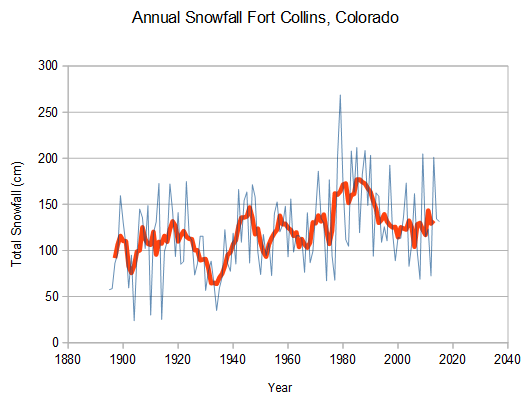
Same pattern in Fort Collins, Colorado
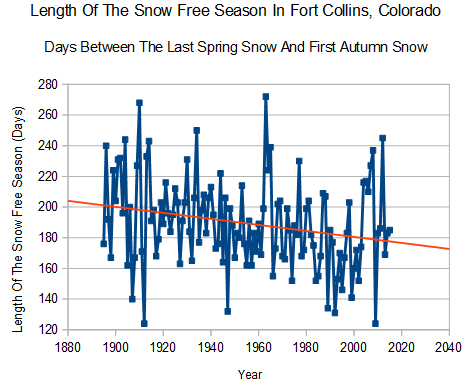
The length of the snow free season in Fort Collins has shrunk by twenty days since the 19th century. Snow falls later in the spring and earlier in the autumn than it used to.
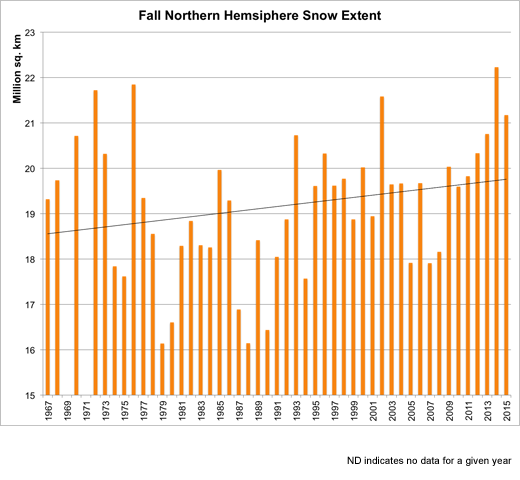
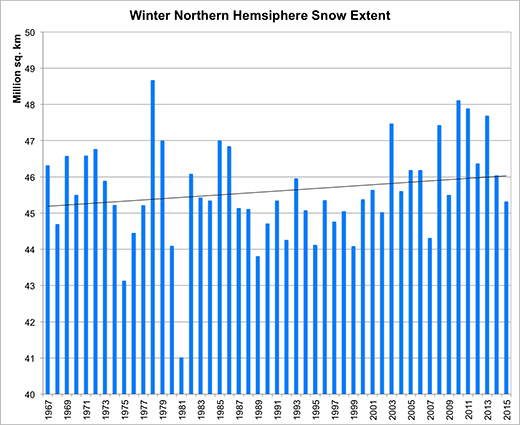
Northern hemisphere autumn and winter snow cover has increased to record levels, due to cold Arctic air pushing further and further south.
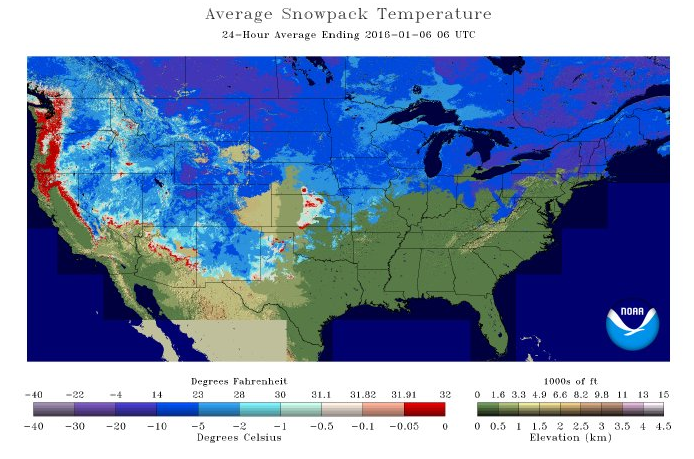
Almost the entire state of New Mexico is covered in snow, right down to the Mexican border.
Climate experts have fully retreated from the real world, and reside is the fantasy land their funding requires. Children will grow up to believe that scientists are all idiots or liars.

No, they will grow up to believe that climate science, like christian science, political science, etc., are just things that include the word science for no particular reason.
IF they get to grow -up at all.
What Marty and others don’t realize is it doesn’t take full glaciation to be a royal PITA for the human race. The slide into glaciation is quite bad enough especially when the goal of ‘world leaders’ is to squeeze every last drop of wealth from the masses even if they have to starve them to death.
“The lesson from the last interglacial “greenhouse” in the Bahamas is that the closing of that interval brought sea-level changes that were rapid and extreme. This has prompted the remark that between the greenhouse and the icehouse lies a climatic “madhouse”! — Neuman and Hearty (1996)
Even a drop back into the weather of the 1970’s could be worrying. The Köppen climate classification, ?widely used, vegetation-based empirical climate classification system. In the 1970’s the climatic change shifted the Köppen climate boundary over 2 degrees lat. or 150 miles (240 K) south.
http://www.sturmsoft.com/climate/suckling_mitchell_2000_fig2_3.gif
This is a major problem for Canada and Russia and the rest of the world.
Especially since the Grain Traders convinced the USA to ditch a grain reserve and turn the excess into biofuel.
Goldman Sachs LOVED it! How Goldman Sachs Created the Food Crisis
Dan Amstutz is the thread who runs through out. Under President Reagan (Yes a Republican) Dan Amstutz, VP of Cargill, wrote the draft Agreement on Agriculture (AoA) as USDA undersecretary for international affairs. Amstutz also wrote the “Freedom to Farm Bill” later known as Freedom to Fail Act that wiped out USA farmers, the US Strategic Grain Reserve and set-up the 2008 food crisis orchestrated by Goldman Sachs. Amstutz also worked for Goldman Sachs and was president of the North American Export Grain Association (NAEGA) from 1994 to 2000. “Throughout his very successful career Dan Amstutz represented and championed ideas and goals of NAEGA membership. “ — A Lasting Tribute by the NAEGA who developed the Amstutz Award to honor the baby killer.
Back to the 1970s grain crisis.
The 1974 CIA report:
“A Study of Climatological Research as it Pertains to Intelligence Problems”
It’s not cold in Minnesota in January until it’s -20. It’s common to get to -50 in parts of Minnesota at some point in winter. Vikings will have a home-field advantage! Should be a good game. Fans will be in the parking lot having tailgate parties, playing broomball and hockey like no big deal.
There have only been nine sub-zero games in NFL history.
And every one of them was in past 60 years. SEE??? CLIMATE CHANGE!
LOL
The snow drought in Europe will soon be a thing of the past, as it is turning cold and snowy, even in the low level cities by next week.
Cold schmold. We get -20 all the time in northern NY.
Which is the reason I headed south. Nice not to have to shovel snow.
Your in for more than your share of the white stuff this year if the guys at Weaterbell are right Gail.
Yea, but it is warm snow. 😉
Minnesota lost the cold advantage when they went to a domed (or balloon as the case is) stadium. Greenbay on the other hand still plays on frozen fields.
That’s true! They had the Metrodome from 1982 to 2013. So maybe the Vikings will be feeling the challenge? “This is the first time since 1976 that an NFL playoff game will be played outdoors in Minneapolis”. http://www.usatoday.com/story/weather/2016/01/06/minnesota-vikings-playoff-game-coldest-nfl-history/78358966/ (Good to see Bud Grant is still alive and kickin’).
If it wasn’t for the Metrodome, there possibly would have been other below-zero games added to the list.
They’re building a new indoor stadium. I guess global warming is not really something Minnesotans are counting on.
As Gail mentioned, it isn’t unusual for farmers and ranchers to lose thousands of their livestock in the snow and cold. Also, people are often found dead every winter within about 100 yards of their vehicles after getting caught in blizzards and -80 windchills back there.
In the recent snow fall in New Mexico, a couple was trapped in their vehicle for over 20 hours as their vehicle was buried in snow. It was good they had a cell phone and could explain to the rescue vehicles of their location. It was a cell phone in the early days of the technology that helped save a woman in South Dakota that went off the road in a whiteout, I can recall. It took triangulation of cell towers and helicopters to rescue her. Governor Bill Janklow wasn’t happy about the bill to save her, however! I think he even threatened to send her the bill.
I’ll take my chances with heat over cold. Being from the north, I’m thankful for fossil fuels.
My parents went through the Great Depression and my dad served in WWII, as many here can relate I’m sure. My grandmother at one time lived on the prairie out in the middle of nowhere in South Dakota (to try farmsteading) and my dad would take the train to visit. He would go into town and buy basic goods for her and drop them out the train window for her as he went back home. He was super thankful for indoor toilet, running water, a furnace, and electric lights.
It wasn’t that long ago when people were living the “green” life and it wasn’t all that great. My dad would laugh and shake his head in confusion at these people today.
Wellllll….. Some Minnesotans are hoping for Global Warming. http://m4gw.com/
😉
The problem is too many people are too far away from actually living the “green” life and therefore have ZERO appreciation for indoor plumbing, central heating, abundant fresh, frozen and convenience foods, easy communication, quick travel and all the other wonders that industrialization has brought us. They rather sit on there fat rumps and whine about CO2 pollution.
I would really really like to drop every single one of them into the 1600s for a few years and then ask them how they like the “green” life. Or maybe just ship them all to North Korea.
The unfortunate part is next week I will be in North Dakota, somehow I am there on one of the coldest weeks so far, after 55 of them I thought I had given them up but work has pulled me back, somehow soggy Arizona looks pretty good right now, to bad I have to leave it for a while. Oh by the way I been in -50 and -40s lots of times. Try to explain to a Arizona that in Minnesota -15 below in the first of November is not all that unusual. If you check you will see Minnesota has measured -30 a least once from October through March, I not certain about April.
There have only been nine sub-zero games in NFL history.
Current PNW ski area snow stats:
http://data.nwac.us/CLISNO/CLISNO.TXT
All areas are >110% of average, with the exception of Stevens Pass, which is 92% (as of the end of December). Seeing how Snoqualmie, one Cascade pass south of Stevens, Crystal, a couple of Cascade passes south of Stevens, and Baker, a couple of Cascade passes north of Stevens, are all well above average, I think it qualifies as local weather.
The skiing here was epic in December. The 17th thru the 23rd was unreal at Crystal (check out the bar chart at their snow page http://crystalmountainresort.com/the-mountain/current-conditions/)! Knee deep, blower powder, i.e. cold, on multiple days! Definitely the best days since at least the 2010/2011 and/or 2011/2012 La Niña seasons. Oh, and Baker and Crystal have two of the top five deepest snow bases in North America right now.
Last year sucked bad for the PNW ski areas; there’s no question about it. Worst season on record for most areas. Crystal had ~235″ total all season, which is about 50% of average. They’ve already eclipsed that mark this year.
With regards to Boulder climate records, caveat emptor applies.
Since 1990 +/- the record is meticulous, being kept by genuine weather geeks and data tyros. As a fellow co-op observer (for nearby Coal Creek Canyon, 4000 feet higher) I’ll vouch for their care and diligence.
But before 1990, the record is checkered (rhymes). There was a period in the 1980s when the thermometer was placed near a building so it would be more convenient, the rain gauge was near an active sprinkler, and snow wasn’t measured until 5 pm, even if it ended hours earlier and half melted. From 1947 to 1970, the thermometer was on the roof of the downtown fire station, easily adding a +2F bias to all readings.
The chart of annual snowfall does not give seasonal snowfall, of course, but back in the snow season of 1979-80, several of us snow geeks in town measured 150 inches or so for the seasonal total, while the “official” record was much less – maybe 100 inches. Most Boulder snow historians will grant that as Boulder’s snowiest winter ever, although you’d never know that from the official records.
So, again, caveat emptor.
The pattern in Fort Collins is almost exactly the same.
Thanks for posting the FCL records, and yep, the snowfall pattern is similar to Boulder.
Except in the 1980s, which is a min in Boulder and a max in FCL. Knowing the FCL observers at the time, I’d say that record is the correct one. Especially that spike in 1979/80.
On a sort of related track
weather-related-losses-have-been-in-DECLINE-since-1990
https://notalotofpeopleknowthat.wordpress.com/2016/01/06/weather-related-losses-have-been-in-decline-since-1990/
There is another point that this post of Steven’s highlights. It is a point all, or at least most of us miss.
It is LAND that cools the fastest. That is why 65N is critical to the Milankovitch cycles.
The Oceans are giant hot water bottles keeping the COASTAL areas warm a lot longer than the interior. Remember the coastal areas are where most of the cities (and recording stations) are while the interior, like the US great plains and Russian & Canadian wheat belts are where the farms are. This means world temperatures, especially NOAAs, mean diddley because we are measuring the wrong place. If farmland cools we are in deep caca especially given the new government policies I mentioned above.
The energy in the lower atmosphere is actually temperature PLUS water (latent heat of vaporization) When the earth cools it gets drier and if the energy in water vapor is ignored you could actually see the temperature rise as the earth cools. (Deserts are hotter than rain forests for this reason.)
Frank Lansner has done quite a bit of work separating out the temperature signal from coastal areas vs interior. January 6, 2014 The Original Temperatures Project
An example:
http://hidethedecline.eu/media/AORIT/SUM/3.gif
I hope the red line is visible.
Frank also has a very telling comment on BEST (Zeke, the Mosh pup & Muller)
So by using mostly COASTAL big city weather stations BEST and Gavin can wipe out that irritating 1940’s blip.
2009
https://chiefio.files.wordpress.com/2010/01/ghcn_giss_250km_anom11_2009_2009_1981_1990.gif
2010
https://stevengoddard.files.wordpress.com/2010/10/outofafrica.gif
And it gets worse as times goes by.
Jan 2015
https://stevengoddard.files.wordpress.com/2015/01/ncdcafricafaking2.gif
The True size of Africa for the GoreBots.
https://i0.wp.com/infobeautiful2.s3.amazonaws.com/true_size_of_africa.png
………………..
I don’t want this bit of info lost.
Al Tekhasski has a great comment on “The Elusive Absolute Surface Air Temperature (SAT)”
What a bunch of slime you find every time you you dig into the ClimAstrologist’s records.
“The True size of Africa for the GoreBots.”
That’s a really cool image. Thanks Gail!
Deserts are only hotter during the day Gail. As I am sure you are aware.
I used to think that too then a few years ago Sleepalot and I looked at the real world data. link (Lost of discussion pro and con)
But it all goes back to the ENERGY = Temperature + energy bound in water vapor.
And yes I am aware that deserts are very cold at night but the mean is higher for deserts than it is for a rain forest. It surprised me until I thought about it.
ENERGY = Temperature + energy bound in water vapor.
That is why temperature is a really rotten parameter to measure.
And they’re dark at night too….WTF is that about
wizzum,
It is about why ‘Global Temperature’ is an idiotic thing to calculate. Especially when it is used to wreck the economy. It is also a rotten number for determining climate or whether or not the climate is cooling or warming since land away from the influence of the sea responds faster to climate change compared to the oceans.
For farmers growing our food this is a very critical point esp. when the governments are lying their heads off.
Well, in the final analysis, I would think it matters most what desert one is comparing, to what rainforest.
The Olympic Peninsula rainforest is cooler than the Kalahari desert, just to hazard a guess, and the Amazon rainforest must be warmer than the Gobi desert, no?
And I think Wizzum may be right…it is dark at night out in the middle of nowhere. Even if it is not a desert. Cold in winter, too.
The other thing that needs to be pointed out is that rainforests are cooled by rain falling from altitude, and deserts are warmed by dry air descending and heating up by compression. This is true whether they are rain shadow deserts, or those in the descending part of the Hadley cell, like the Sahara.
So I do not think it is really a simple issue at all. Heat is being actively transported in these regions.
Awesome graphic of Africa Gail! Kudos to you.
That is amazing. I look at maps and globes all day long, and it is still surprising.
Gail,
The 2015 “NCDC Measured” map of Africa doesn’t appear accurate, since it shows Niger as being essentially station-free.
Niger has 18 stations in the GHCN inventory dating back to 1906, with 15 still reporting in 2015.
I looked up various African and Middle East station records in response to the much-repeated 2010 article by Joe Romm spewing Jeff Master’s claims that “nine countries have smashed all-time temperature records.”
In the case of Niger, where all the stations have spotty records, the Saharan oasis town of Bilma “smashed” its 1939 record of 47.8°C by a whopping 0.5°. However, the claim that’s a record for Niger appears to be an outright lie, since Guigny recorded 49.8°C in 1988 and Niamey recorded 50.8°C in 1976.
The all-time record “smashed” in Kuwait was at Abdaly—a station that set the previous record when it first opened in 2005.
The map is actually Steven Goddard’s and it is only for the month of January. What may be happening is what E.M. Smith found happening in Bolivia.
So the data could easily be reported and available but not actually used. Given that it is coming from third world countries the chances the data is too late is very good.
KevinUK also did some work on the station dropout problem (many many blog posts)
https://i1.wp.com/www.climateapplications.com/GHCN/images/Raw_Africa_Stacked.png
https://i1.wp.com/www.climateapplications.com/GHCN/images/Raw_Africa_Unstacked.png
That is from 2010 but as you can see the number of stations was drastically reduced and the number used erratic.
So the data could easily be reported and available but not actually used.
That would also be my assumption, it is well known that active stations are being ignored. Artifacts are being fabricated, instead of actual data being reported
This was the link to the data steven goddard used
http://www.ncdc.noaa.gov/temp-and-precip/global-maps.php?imgs%5B%5D=map-land-sfc-mntp&imgs%5B%5D=map-blended-mntp&imgs%5B%5D=map-prcp&imgs%5B%5D=map-percentile-mntp&imgs%5B%5D=map-percentile-prcp&imgs%5B%5D=map-prcp-percent&year=2014&month=12#maps
Thanks for the additional info. Maybe I’ll see the drop-out issue when I look at other African nations. I don’t see it with Niger or Nigeria daily summaries.
The link to the maps gives me a 404. No matter. Just pointing out there is Niger station data in the form of GHCN daily summaries from NCDC. (Also noting that some fear mongers ignore what’s inconvenient to their narrative.)
There are plenty of days with missing data in the daily summaries. Bilma, Niger, is missing about 25%, while Nigerian stations I looked at were missing more than 90%. Kinda hard to get trends or averages without filling in some blanks.
That said, it’s doubtful the Niger data is being ignored. There are hefty uptrends at some stations (perhaps related to a 50-year population increase from 1.7 to 15.7 million).
Data charted at verdeviews.com.
Thanks for the info. As I said the map was Steven Goddards and only for one month.
E.M. Smith did a similar map for 2009 HERE
Steven, for months, you have been telling us that the Arctic sea ice was increasing at a record pace. I’m sure you said that here more than a few times. Apparently it started from a very low value because it still hasn’t gotten out of the hole yet:
http://climatecrocks.com/2016/01/06/sea-ice-starts-2016-in-the-hole/
Who are accusing of fraud on this? Do you have any evidence of fraud, or will you continue to rest on your own private graph?
BTW, it has always been expected that snowfall in the mountains will increase as warming increases. At least for some time. Do I really have to explain to your readers why that increase must happen, or will you man up and do it yourself?
Two points you have yet to answer.. because you KNOW you can’t
1. Arctic sea ice is pretty much where it should be for the phase of the AMO
2. Arctic sea is very much higher than the first 3/4 of the Holocene
Until you can answer either one of these points you really ought to STFU,
or prove yourself to be the moronic, brain-washed AGW cretin that you are.
See how little Marty AVOIDS answering.. because he KNOWS he can’t.
How come there’s so much less Arctic Sea Ice now than last time AMO was in this phase?
LIA, idiot !!
cfgjd,
Tell me how much of the sea ice is in the ocean and how much is in the air?
Oh look, another scientifically illiterate troll that can’t grasp the concept of cyclic functions.
http://bitsocialmedia.com/wp-content/uploads/2013/07/Internet-Troll.jpg
SHOO!
And seriously,.. citing that moron, incompetent, low-end video maker..
….. you have surely got to have more than that !!
Not even YOU can go that low……………………. oh wait.. that is where you came from.
Andy why do scientists argue that LIA ended before the 20th century?
The Little Ice Age ended around 1850. I have posted that peer-reviewed paper several times in the last few days.
Now tell me cfgjd,
Tell me how much of the sea ice is in the ocean and how much is in the air?
What would you know about scientists?
“why do scientists argue that LIA ended before the 20th century?”
Have you ever noticed that when you accidentally leave the door to the freezer section of your refrigerator open, that as soon as the warm room air hits it, all of the contents simultaneously and instantly melt?
Just because the LIA ended in 1850, doesn’t mean there wasn’t still some necessary warming to be had, and a LOT of extra sea ice still hanging around.
And there is PLENTY of anecdotal evidence that there was probably significantly lower sea ice in the 1920’s.
Winter in the NH ends long before the heat of Summer hits full stride. What is your point?
Whoops.. too early ….. meant the 1940’s…
“Who are accusing of fraud on this?”
Does anyone see the word “fraud” in SG’s post.
Sure , we see gross incompetence, scientific maleficence, morons, idiots, LIARS etc etc.
And sure , we all know its FRAUD,, but SG does not use that word
Marty just ASSUMES it is FRAUD……… because he knows it is FRAUD.
Where’s the proof of fraud? Got any peer-reviewed shit to show?
US scientists significantly more likely to publish fake research, study finds
NATURE: Publishers withdraw more than 120 gibberish papers
Just peer-review your own papers…
SPRINGER Retraction of articles from Springer journals: Springer confirms that 64 articles are being retracted from 10 Springer subscription journals, after editorial checks spotted fake email addresses, and subsequent internal investigations uncovered fabricated peer review reports. After a thorough investigation we have strong reason to believe that the peer review process on these 64 articles was compromised….
“Peer review is sick and collapsing under its own weight,”
Unreliable research, Trouble at the lab: Scientists like to think of science as self-correcting. To an alarming degree, it is not
SAGE Publications busts “peer review and citation ring,” 60 papers retracted
How Many Scientists Fabricate and Falsify Research? A Systematic Review and Meta-Analysis of Survey Data
Why Most Published Research Findings Are False
I have plenty more in my scientific fraud file.
Where’s the proof NV is not to blame? Got any peer-reviewed shit to show?
Remember, you said if it is not in the peer reviewed literature, it does not exist.
Paper please! 😆
BTW, it has always been expected that snowfall in the mountains will increase as warming increases.
So what model predicted this?
After Texas experienced an uncharacteristically balmy Christmas Day, a massive blizzard struck the western half of the state. A dozen people died in the 48-hour-long storm that began Dec. 26, and the New York Times reported that a staggering 35,000 dairy cows were lost in the deluge.
But it was not the cold that killed most the cows. While some did freeze to death, it is likely that the majority starved to death. According to the Times, with snow drifts as high as 14 feet in some spots, many ranchers judged the trek to feed their herds to be impossible.
Gee, sure seems like the cows and people faired much better with warmer than average temperatures versus colder than average.
Found that paper yet Marty? Or is it just more convenient to lie when it comes to protecting your precious cause?
https://www.youtube.com/watch?v=Iz-8CSa9xj8
More on that story…
“Calves that had been nestled inside stalls starved when no one was able to reach them. Some farmers who tried to retrieve their animals got lost and disoriented….
A dozen people died in the 48-hour-long storm…..
….. as farmers began to discover more cows and calves in the melting snow, the death toll surged to more than 35,000, or about 10 percent of dairy cows in the entire region.”
And then the completely idiotic statement ONLY a citified no nothing journalist could make!
“The striking level of animal carnage brought to light a concerning factor regarding the welfare of outdoor farm animals. Dairy cows graze outdoors year-round but can be kept in barns during severe weather….”
Good grief didn’t the Arrogant A…hole READ what he himself just wrote???
“Calves that had been nestled inside stalls starved when no one was able to reach them. Some farmers who tried to retrieve their animals got lost and disoriented….”
>>>>>>>>>>>>>>>>>>>
FIRST, what is the average age of the American Farmer? The average age is over 58 and 33 percent are 65 and older as of 2012. The older age groups all increased in number since the last Ag Census. And yeah they are retiring, (and selling to builders) the number of U.S. farmers declined between 2007 and 2012 going down 4.3 percent.
Now picture granddad and grandma out staggering around in that blizzard…. It is a wonder no more people died. Or maybe both partners died and hadn’t been found at the time the story was written. ( more than 50 people were killed in 14 states and dozens were injured.)
My Grandmother grew-up on a dairy farm and the barn was UNDER the house for just that reason. You can get to your animals to feed and milk them no matter what the weather. Now it is ILLEGAL to build a house barn combo….
In northern climes when you know a blizzard is due you string a line from the house to the barn so you do not get lost. This is what my Father in -law did here in the Midwest. But you have to KNOW a blizzard is due or have the line strung in the fall.
I lay the blame for these deaths on USDA Climate Hub to Provide Practical, Science-Based Information to Farmers, Ranchers and Forest Landowners and on NOAA who is so busy kissing Obama Arse that farmers and ranchers were completely unprepared.
And yes I watch the weather closely but I am not sure all my animals would survive it that type of weather. Unfortunately even if you provided round bale hay under sheds they might not make it. “Turley said, “The snow was just one part of Goliath. It was the wind that led to drifts as high as 14 feet, where many animals died. Wind will push animals into a fenced corner where they can suffocate in snow drifts.””
Unfortunately the Lying government Arses are sticking to the party line. Turley said. “It’s a once-in-a-lifetime (storm)”
From what I read, those cows suffocated under snow drifts. The extreme winds forced them up against fence corners, and the 14′ drifts suffocated them.
Happened all the way into New Mexico, not just Texas.
Yes, I was about to mention that. Even if you had run-in sheds with a round bail feeder full of hay they still might have been killed thanks to the wind and drifts.
This is typical of the type of shelter you see in the south in the USA.
http://www.silverstarmini.com.au/general-care/care6.jpg
http://www.silverstarmini.com.au/general-care/care5.jpg
or even this
https://s-media-cache-ak0.pinimg.com/736x/e5/0f/48/e50f4817565fef1760fd02312e6e0ba7.jpg
Martin,
If there is warming, snow levels should be getting higher in the mountains, even assuming that there is more precipitation. There is absolutely no evidence that snow levels are getting higher. Can you prove that they are?
Martin Smith says:
January 7, 2016 at 7:23 am
“Steven, for months, you have been telling us…
Martin, for months you’ve been making a fool of yourself with your idiotic, slanderous BS trolling.
One day perhaps you will catch on to the concept of cyclic processes, and realise that extended linear trends flat out do not exist in any form of science, climate or otherwise, and that the use of regressions and other statistical methodology is only applicable to those with some grasp pf statistics, which doesn’t include you.
So piss off back to your crackpot alarmist blogs run by mad women with obsessions about “hot whoppers” and similar fantasies, and leave science-oriented blogs to the scientifically literate.
SHOO!
I hope Seattle wins. I’m from Tacoma. I swam for the Wilson Rams. State champs every year. Yup, that’s me. Go Seahawks!
Ahhh, Too much chlorine exposure… that explains a lot.
Here’s a better Arctic sea ice graph. Easier to see what’s happening. Look up in the left hand corner:
http://nsidc.org/arcticseaicenews/charctic-interactive-sea-ice-graph/
The other left, Ted, the other left.
Two points you have yet to answer.. because you KNOW you can’t
1. Arctic sea ice is pretty much where it should be for the phase of the AMO
2. Arctic sea is very much higher than the first 3/4 of the Holocene
Until you can answer either one of these points you really ought to STFU,
or prove yourself to be the moronic, brain-washed AGW cretin that you are.
Again….. little goreboy posts but does not answer the points.
Come on slimo….
PUT UP OR SHUT UP
http://ocean.dmi.dk/arctic/old_icecover.uk.php
DMI still says we started the year strong looking at 30% ice cover… Yours is only 15%..
The graph is wrong, Dave, because it it deliberately leaves out coastal areas. That’s not me saying so, it’s the DMI. The DMI also provides the correct graph. You can find the correct graph by clicking on the link in the explanation DMI provides on the incorrect graph, where the DMI explains why the incorrect graph is incorrect.
“it deliberately leaves out coastal areas. ‘
Yes, that is because coastal area are indistinct and inaccurate.
Again I say.
PROVE that the data DMI is incorrect .. or WITHDRAW back into Big Al’s crevasse from whence you came..
Martin, you seem incredibly imbecilic.
You have variously stated that the graph is somehow Tony’s “private graph”, that the graph is wrong, that DMI provides the “correct” graph, and that the one you prefer is “better”.
But you have also admitted that you are aware that both graphs are DMI products!
They are measuring different things.
Just to back up a little, say ten years or so…the graph that you claim is no stinkin’ good was the one in use by you alarmist jackasses for a very long time, back when it showed a supposedly alarming trend of decreasing sea ice (although just how it is that less of our planet locked into a perpetually frozen ice-hell wasteland, is somehow a disaster, was never explained very well). Yes, the graph with the coastal areas masked out was just fine for your warmista friends and you all along, right up until it needed to be discredited because it was not alarming enough for you.
So, getting back to the original point…which is it Marty? Is it merely better, or is it “real” and the other one fake?
Since they are both produced and presented by the same organization, by what strained logic is it Tony’s private graph?
Since there is a clear explanation of why there are two graphs, measuring and presenting different data sets, by what set of twisted lie-baby rules in one wrong, and the other the correct one?
Do you realize just how idiotic you make yourself out to be, to anyone paying even slight attention?
Your warmista jackassery no longer even has any internal logic.
The graph is CORRECT.. PROVE where it is shows wrong data or STFU.
Where is the data INCORRECT….. are you accusing DMI of fabrication of data ?
Or you could look here and see the 30% ice is doing just fine. That little warm weather took out some of the slushy 15% ice but the base ice cap looks to be doing just fine marty. Much to your chagrin!
http://ocean.dmi.dk/arctic/old_icecover.php
Martin-
Until right now, my only comment in this thread was a snide response to a comment Tony made about football games. I have no idea why you’d reference me in your completely off topic post. I don’t even comment about arctic sea ice extent, as I don’t follow it closely.
Exactly what makes your graph more relevant than the ones Gail posts?
http://ocean.dmi.dk/arctic/icecover.uk.php
“The plot above replaces an earlier sea ice extent plot, that was based on data with the coastal zones masked out. This coastal mask implied that the previous sea ice extent estimates were underestimated. The new plot displays absolute sea ice extent estimates. The old plot can still be viewed here for a while.”
1. PROVE that the data is incorrect
Counter the FACTS that
2. Arctic sea ice is pretty much where it should be for the phase of the AMO
3. Arctic sea is very much higher than the first 3/4 of the Holocene
Do that.. or forever remain a low-end, ignorant CRETIN
or run, run, run … and avoid answering these three points.
” The old plot can still be viewed here for a while.”
If the plot was WRONG or bad or whatever it would have been WITHDRAWN. Instead it is still available and still up dated.
The only reason for the new graph is because they now have the ability (and computer power) to ESTIMATE the ice between 30% and 15% and the ice in all the bays and fjords along the coasts. This ESTIMATE is STILL going to be subject to a lot of error, which is why they stuck to 30% ice and masked the coastline in the first place!
https://upload.wikimedia.org/wikipedia/commons/thumb/a/a2/Map_Canada_political-geo.png/800px-Map_Canada_political-geo.png
I’m wondering how they can estimate ice cover in the darkness of winter at high latitudes? When I look on NASA’s WorldView, the winter polar regions have no imagery from visible channels because of the darkness. There is still data from IR channels, but I’m not sure you can easily detect ice boundaries with the IR data.
https://earthdata.nasa.gov/labs/worldview/
Little goreboy has three points to respond to
1. Prove that the DMI data is incorrect
2. Arctic sea ice is pretty much where it should be for the phase of the AMO
3. Arctic sea is very much higher than the first 3/4 of the Holocene
Will he rise to the challenge .. or will he continue to AVOID ANSWERING
The DMI says:
“The plot above replaces an earlier sea ice extent plot, that was based on data with the coastal zones masked out. This coastal mask implied that the previous sea ice extent estimates were underestimated. The new plot displays absolute sea ice extent estimates. The old plot can still be viewed here for a while.”
http://ocean.dmi.dk/arctic/icecover.uk.php
Still avoiding .. still RUNNING like a COWARD
1. PROVE that the data is incorrect
Counter the FACTS that
2. Arctic sea ice is pretty much where it should be for the phase of the AMO
3. Arctic sea is very much higher than the first 3/4 of the Holocene
Do that.. or forever remain a low-end, ignorant CRETIN
or run, run, run … and avoid answering these three points.
Poor Marty, a dead fish with a mind of a single celled amoeba, dangling on the end of a fishing line.
And what’s even better.. he is stuck here.. HE CANNOT ESCAPE. 🙂 🙂
Fun future fun for all.
Please stick around until a couple of months the El Nino subsides, Marty…
… we all what you laugh at you some more. 😉
AndyG55, Martin will eventually go the way of “Blowtorch” Reggie…
Andy, you are missing the point in such a grand way. The downward trend in Arctic sea ice isn’t unprecedented because of its magnitude and speed. It is unprecedented because WE ARE CAUSING IT.
Avoid the questions Marty.. run, run , run
The decline is almost exactly in line with the AMO.
The REAL DATA SHOWS that.
ANSWER THE 3 POINTS .. CRETIN !!!
“WE ARE CAUSING IT’
BULLSHIT !!
Bloody hilarious watching little Marty trying to avoid answering those 3 points.
and making an ABBSOLUTE FOOL of himself.
Keep going Marty..
Everyone is watching 😉
Andy, I have shown why your questions are of little interest, so you can choose any answer you want to believe. Here is the point again:
The downward trend in Arctic sea ice isn’t unprecedented because of its magnitude and speed. It is unprecedented because WE ARE CAUSING IT.
Avoid , avoid.. run. run.
bloody HILARIOUS. 🙂
“WE ARE CAUSING IT.”
Yep, just like we cause the massive decrease about 10,000 years ago as we climbed out of the last major ice age.
You seriously are making a MORONIC FOOL of yourself , Marty
Are you really THAT DUMB that you cannot see that ????????
You have THREE points to counter.
Time to start.. child-mind. or keep running. 😉
Andy-
I spent a week trying to sort through his pathetic attempts to answer questions. Consider yourself lucky he’s running. There’s simply no way to debate a man who doesn’t understand his own position.
http://memecrunch.com/meme/4BA04/arguing-with-an-idiot-is-like-playing-chess-with-a-pigeon/image.png
Ted,
And then they wonder why we resort to sarcasm and ridicule out of sheer frustration.
WE ARE CAUSING IT
BULLSHIT!
Marty lies again, and again, and again, and again…
1- List all climate forcings, order them from most to least effectual, and then quantify them all.
2- Please provide even one peer reviewed paper that refutes natural variability as the cause of recent, or any, global climate changes.
There is nothing unusual or unprecedented about our climate, or how we got here. For 4,500,000,000 years climates have always changed, naturally. This means there has been a set precedent, and the burden of proof falls on natural climate change deniers like yourself.
How many times must I rub your nose in your own excrement before you stop lying child?
How come climate skeptics cannot do science? Oh sorry, there was this ONE poster in AGU2015, ROTFL 😀
YAWN
yet another empty ,empty post from cfool.
How come climate alarmists cannot do science? There is not ONE paper that refutes NV, by far the most likely cause of climate change. ROTFL 😀
1- List all climate forcings, order them from most to least effectual, and then quantify them all.
2- Please provide even one peer reviewed paper that refutes natural variability as the cause of recent, or any, global climate changes.
There is nothing unusual or unprecedented about our climate, or how we got here. For 4,500,000,000 years climates have always changed, naturally. This means there has been a set precedent, and the burden of proof falls on natural climate change deniers like yourself.
Remember this from waaaay back?
cfgjd says:
December 9, 2015 at 3:27 pm
Submit to a Journal or it does not exist…simple rule.
So refutation of natural variability “does not exist”! 😆
Eat dirt dummy!
Marty says: “….The downward trend in Arctic sea ice isn’t unprecedented because of its magnitude and speed. It is unprecedented because WE ARE CAUSING IT.”
>>>>>>>>>>
Is he talking about all those ice breakers breaking up the ice packs so they are more likely to be flushed out into the warm Atlantic where the ice melts?
It does make you wonder Gail.
http://i255.photobucket.com/albums/hh154/crocko05/USCGCHealy_zps7e8e6565.jpg
Nice illustration of what I was talking about. Remember most of that will be in the coastal areas that Marty and his buddies want included in the data.
I would like to see a graph of Arctic sea ice and the rise of the use of icebreakers. I bet you could get a really nice looking graph like Co2 and temp with it.
http://www.uscg.mil/hq/cg5/cg552/docs/20130718%20Major%20Icebreaker%20Chart.pdf
The newer Russia icebreakers use nuclear power to actually HEAT the ice and melt it. !!
Hot water jets below water level etc etc.
Tell me Marty, how much of the sea ice is in the ocean and how much is in the air?
Great article from Ed.
https://edmhdotme.wordpress.com/2015/06/01/the-holocene-context-for-anthropogenic-global-warming-2/
Perhaps Marty could post a repost on ed’s site….
…… and get his arse handed to him YET AGAIN.
Let’s see what happens, shall we?
Watching.. with much popcorn. 😉
Apparently he censored my post. He replied to me by email, but he tried to support his fallacious argument by claiming the main greenhouse gas is water vapour. He seems unaware that the water vapour that is in the air is there because the CO2 warmed the air enough to hold the water vapour in the first place.
I still have my head, Andy, and Ed’s “great article” was indeed nonsense.
roflmao..
The only nonsense around here is YOUR posts.
Come on .. stop running..
Its truly PATHETIC..
“He seems unaware that the water vapour that is in the air is there because the CO2 warmed the air enough to hold the water vapour in the first place.’
ROFLMAO
That is probably the most MORONIC thing even you have ever come up with.
True fantasy !!!
What little Marty is saying is that CO2 cause evaporation
Can it get any funnier !! 🙂
Please Marty.. too much hilarity for one day..
Go back to your SkS sandpit !!
Martin says: “He seems unaware that the water vapour that is in the air is there because the CO2 warmed the air enough to hold the water vapour in the first place.”
This will probably come as news to just about EVERY scientist!
You are joking, aren’t you? Please tell us that you’re not that stupid.
The MAIN source of energy needed to evaporate water comes from the SUN. The amount of heat able to be generated by carbon dioxide’s LWIR is minuscule compared to the sun.
Yep, xyzzy11 That is what he said..
Quite hilariously idiotic , hey . 🙂
What moronic inanity will he come up with next, we wonder.
Guess we better keep poking him and see.
Marty says:
“….he tried to support his fallacious argument by claiming the main greenhouse gas is water vapour.”
>>>>>>>>>>>>>>>>
OH MY GOODNESS!
That is the funniest statement from a warmist I have seen yet!
Now I have to clean my keyboard and screen again. What do they teach these kids now a days. I can barely see I am laughing so hard. Best run back to SS to get that straightened out Marty. You got the Dogma wrong.
http://4.bp.blogspot.com/-v4833RhLE_E/Tw22kabjfSI/AAAAAAAACSE/BuGRpVFctFQ/s1600/ROTFLMAO%255B1%255D.jpg
I hope SG see that post.. SG where are you !!!
It must come in as one of the DUMBEST, MOST IGNORANT posts every made on any forum, anywhere.
Nearly deserves a thread all on its own, so everyone can see it. 🙂
“I still have my head,”
You mentioned “black holes” the other day. !!
“I still have my head”
http://media.ourstory.com/11/77/91/25ee81ee77b82306c31f7ce1a4268d8faba96982/9281731847a820e2f518ef9e8a5a06c110ce50c6-l.jpg
Each time I think you have reached the height of your ignorance you amaze me again Zachary/Marty/ Winston.
I really thought you not knowing how the arctic was defined was pretty stupid but this takes the cake.
“Apparently he censored my post. He replied to me by email, but he tried to support his fallacious argument by claiming the main greenhouse gas is water vapour. He seems unaware that the water vapour that is in the air is there because the CO2 warmed the air enough to hold the water vapour in the first place.”
Bill Nye would disown you .
His conclusion is wrong, Andy: “When the postulated warming in the coming century as promoted by the IPCC and other Global Warming alarmists is collated against the progress of actual Holocene temperatures, the absolute implausibility of the Man-made Global Warming hypothesis by adding comparatively marginal amounts of CO2 to the atmosphere becomes obvious.”
That’s false. The alleged warming of the early Holocene says nothing about the current warming.
No.. YOU are wrong..
You cannot counter his points..
and your certainly can’t counter my points.
Keep running..
keep avoiding.
I posted a reply, Andy. It didn’t appear yet. I suppose he is moderating the replies. I countered his “point” which does not follow from his argument.
Still running, still hiding PATHETIC
You have three things to answer
PUT UP or SHUT UP
He’s probably laughing too much from whatever idiotic reply you posted.
“The alleged warming of the early Holocene says nothing about the current warming.”
BULLSHIT, of course it does.
It shows we actually at the COLDER end of the Holocene
….. STOP AVOIDING AND RUNNING
It really is really PATHETIC of you.
Even a worm could do better.
Marty, why is the current Holocene (the modern warm period) colder than the past 4 interglacials even though it has the highest CO2 levels?
http://i255.photobucket.com/albums/hh154/crocko05/Temp%20vs%20CO2%20-%20400000%20years_zpskyy0qvra.jpg
‘When the postulated warming in the coming century as promoted …. blah blah…”
Yep we have seen that postulated warming put against reality.
Turns out its postulated NONSENSE and so INACCURATE that that if there was a whole barn there.. they wold STILL miss it !!!
typo… would STILL miss it. !!
For those who might be confused by Marty’s blatherings:
1. The atmosphere contains 720 billion tons of CO2 and humans contribute only 6 GT additional load on this balance or about 0.8%. , Termites alone emit ten times more carbon dioxide then us humans.
2. The effect of CO2 as it increases is logarithmic more and more CO2 has less and less effect. Even the IPCC shows this.
https://wattsupwiththat.files.wordpress.com/2014/08/clip_image002_thumb3.jpg
3. The temperature increase as CO2 increases falls off drastically.
https://wattsupwiththat.files.wordpress.com/2010/03/heating_effect_of_co2.png
4. The entire CO2 forcing is 32 to 44 W m–2 [cf., Reid, 1997]. and all but 5 to 6 W m–2 of that forcing occurs in the first 200 ppm CO2! 10W m–2 will raise the temperature 1°C or less.
5. What about the Milancovitch cycle that Marty dismisses as irrelevant? How does that 5 to 6 W m–2 of CO2 forcing from 200 ppm to 400 ppm compare to the loss of solar energy during the Holocene interglacial?
We can go to NOAA and Berger’s 60N Solar Insolation calculations from
http://www1.ncdc.noaa.gov/pub/data/paleo/climate_forcing/orbital_variations/berger_insolation/insol91.jun
Holocene peak insolation: 523 Wm-2
……………………………………………..decreased = 47 Wm-2
NOW (modern Warm Period) 476 Wm-2
…………………………………………….. decreased = 12 Wm-2
Depth of the last ice age – around 464 Wm?2
11,000 years ago…………… 523.16 Wm-2 peak insolation
Wisconsin Ice age- Holocene transition
12,000 years ago…………… 522.50 Wm-2
It takes about 5 Watts per square meter to raise the worlds temperature from 15°C to 16°C.
Or we can also look at this paper.
Temperature and precipitation history of the Arctic
So even if you are talking 9% of Trenbreth’s “incoming solar radiation… absolute forcing,… around 340 W m–2 at the top of the atmosphere” the reduction in solar radiation since the Holocene Climate Optimum is 30.6 W m–2. Or 10W m–2 = 1°C or less.
800,000 years
https://edmhdotme.files.wordpress.com/2015/06/screen-shot-2015-11-25-at-10-30-49.png
250,000 years with Milankovitch cycle solar insolation at 65ºN.
Note thesolar insolation for the present.
http://www.warwickhughes.com/agri15/BIGw02-milankovitch-and-temperature.png
If Mankind is managing to keep the earth warm, all I can say is GO FOR IT! Our interference may be all that is preventing glaciation or at least a very nasty cold and violent climate that makes the Little Ice Age look like a vacation in Hawaii.
Marty, do you realise that ANYONE that reads the forum can see you AVOIDING my three points.
EVERYONE can see you running, ducking, weaving like a little worm.
This is what the below average alarmista troll does when cornered…
And believe me, below average means ……. incredibly DUMB.
Far better you run and hide , Marty, before you do even more damage to the alarmist cause.
Andy, I do understand that everyone who reads your exchanges with me can easily see which of us is right and which is wrong. I’m quite happy with that.
Marty lies again, and again, and again, and again…
WE ARE CAUSING IT
BULLSHIT!
1- List all climate forcings, order them from most to least effectual, and then quantify them all.
2- Please provide even one peer reviewed paper that refutes natural variability as the cause of recent, or any, global climate changes.
There is nothing unusual or unprecedented about our climate, or how we got here. For 4,500,000,000 years climates have always changed, naturally. This means there has been a set precedent, and the burden of proof falls on natural climate change deniers like yourself.
How many times must I rub your nose in your own excrement before you stop lying child?
Yes, EVERYONE can see who is avoiding answering my three points.
PUT UP or SHUT UP.
Here you go, andy:
“1. PROVE that the data is incorrect”
“2. Arctic sea ice is pretty much where it should be for the phase of the AMO”
“3. Arctic sea is very much higher than the first 3/4 of the Holocene”
A1. The data are correct. The graph is incorrect because it leaves out great swaths of the sea.
A2 & A3. My explanation has addressed this. It doesn’t matter whether your A2 and A3 are true or false. What makes the downward trend in Arctic sea ice unprecedented, and what makes the rate of the decrease unprecedented, is the fact that WE ARE THE CAUSE.
Marty lies again, and again, and again, and again, and again…
WE ARE CAUSING IT
BULLSHIT!
1- List all climate forcings, order them from most to least effectual, and then quantify them all.
2- Please provide even one peer reviewed paper that refutes natural variability as the cause of recent, or any, global climate changes.
There is nothing unusual or unprecedented about our climate, or how we got here. For 4,500,000,000 years climates have always changed, naturally. This means there has been a set precedent, and the burden of proof falls on natural climate change deniers like yourself.
How many times must I rub your nose in your own excrement before you stop lying child?
A1. The data are correct.. Thank you.. so there is NOTHING wrong with the graph.
It is the same graph SG has been using from the start.. and you have just confirmed the data is correct.. GAME OVER.
————————————————————————————-
You explanation for parts 2,3 has totally AVOIDED the question.
You are running squirming and hiding like a little worm.
You KNOW they are true, and are trying to avoid saying so.
The downward trend of Arctic sea ice is totally in line with the upward trend of the AMO.. or are you going to RUN and HIDE form that truth as well.
squirmiy little worm.
I have answered all your questions, Andy.
The rate of Arctic decline is NOT unprecedented .. unless you only take the ONE period we have actual data for.
You are LYING .. yet again
You have NO PROOF for ANYTHING you say.. and you know it.
You have answered Q1. correctly
You have totally avoided Q2 and Q3.
EVERYONE can see that.. all those people with even part scepticism can see you AVOIDING.. and they can see that you are afraid to answer.
That is what you always do..
you avoid giving truthful answer when you KNOW they destroy your brain-washed idiocy.
Thanks for avoiding and squirming.. you are so helping the realist side of the AGW farce so, so much.
A traitor to your cause.. because of your base-level incompetence.
And for those who haven’t been watching..
Here is a graph of the Arctic sea ice flipped and aligned with the AMO.
http://s19.postimg.org/4crolmgmr/amo_vs_NHice.jpg
And here is graph of Reykjavik temperatures vs the AMO
http://s19.postimg.org/5vfcwbc8j/amoreyk.jpg
And here is a graph of the AMO vs Arctic sea ice.
The blue dot is just outside the 1sd (pink region) of the 1980-2001 reference period (blue region) And the Arctic sea ice is just below 1sd from the mean of that period.. EXACTLY where it should be
http://s19.postimg.org/f7g5os3ar/Amomean1sd.jpg
Now, little worm
counter Q2 and Q 3 if you dare.
PUT UP or SHUT UP
You can’t argue with Demon-crats. They don’t care about the truth they only care about politics. Look at the BS explanations they give for Obama’s fake birth certificate.
“What makes the downward trend in Arctic sea ice unprecedented, and what makes the rate of the decrease unprecedented, is the fact that WE ARE THE CAUSE.’
UTTER and COMPLETE BULLSHIT.
1.. It is NOT unprecedented,
2.. We are NOT causing it.
You have absolutely NO PROOF of either statement
You LIE, and LIE and LIE again… and its DISGUSTING.
Oh and btw, Iceland Met has reported that 2105 was the COLDEST year this century in Iceland..
https://coloradowellington.files.wordpress.com/2015/11/troll-wong-gwaf.jpg
https://pbs.twimg.com/media/COC5repUEAIfEGh.jpg
Way passed bedtime down here.
Please look after in mentally incapacitated one if he returns. 😉
errata…… in = the
My guess is that an immense amount of pressure has been put on DMI to get rid of this graph
http://ocean.dmi.dk/arctic/old_icecover.uk.php
Where would the pressure come from? Given that they explained why they are switching to the standard parameters, why do you think they are being pressured?
Are you really really that stupid that you can’t figure that out?
Perhaps it’s a LIBRUL GUBERNBENT CONSPIRACY, huh? Danes are Northern-European so they are a LOT more SOCIALIST than US Democrats that are actually very right-wing!
Yes, I guess you really are that stupid. Thanks for proving it.
For those who might not have figured it out: FOLLOW THE MONEY!
What is Denmark’s national debt? 44.5% of GDP (2013) In 2014, the national debt of Denmark amounted to approximately 45.17% of the GDP.
WHAT IS IN IT FOR THE BANKS?
cfgjd says: “Perhaps it’s a LIBRUL GUBERNBENT CONSPIRACY, huh?”
>>>>>>>>>>>>>>>>>>>
Well Common Fool gjd
As a member of Common Future Paris 2015 org, you would certainly know ALL about applying pressure now wouldn’t you?
I was just thinking the same thing. Why else would they go from a graph with less error to a graph with more error?
ASIDE: Steven, why do you allow jackals to mess up your board? You have threatened to block me, apparently because of my views, but you allow unlimited ad hominem attacks. You have cautioned me about posting off-topic on occasion, but there are others here (the obvious ones), who post off-topic quite frequently without any cautioning from you whatsoever.
Back to the point:
For months, you have been telling us that the Arctic sea ice was increasing at a record pace. I’m sure you said that here more than a few times. Apparently it started from a very low value because it still hasn’t gotten out of the hole yet:
http://climatecrocks.com/2016/01/06/sea-ice-starts-2016-in-the-hole/
Who are accusing of fraud on this? Do you have any evidence of fraud, or will you continue to rest on your own private graph?
BTW, it has always been expected that snowfall in the mountains will increase as warming increases. At least for some time. Do I really have to explain to your readers why that increase must happen, or will you man up and do it yourself?
I have to pity the people who use this blog as a source of information about the planet Earth.
Most definitely it is when you and Marty post comments
ANTI-KNOWLEDGE is the most descriptive term I can come up with for what you two present. Empty WRONGNESS from go to onfinity.
Show me the science Andy…even posters are ok!
Plenty there, if you were able to read……. you have never posted ANY. !!
“Steven, why do you allow jackals to mess up your board?”
We all agree its just for the hilarity of seeing your post moronic comments.
Oh.. I thought you said JACKASSES. Fits you to a tee.!
” but you allow unlimited ad hominem attacks.’
Oh no.. Marty’s having another crying tantrum !!!
Do you need a nappy change yet, Marty ? Is that your problem.
How DO you exist in society !!!!!!!
You are STILL RUNNING and SQUIRMING from Gator’s questions and from my Q2 and Q3
Remember.. you did FINALLY answer that the data in the DMI graph that SG uses is CORRECT……
Well DONE. You don’t like that data.. but that’s tough luck. 🙂
baby steps though… baby step.
Tell me Marty, how much of the sea ice is in the ocean and how much is in the air?
Because no matter how many facts we throw at you Marty, you duck and twist and turn. You refuse to understand even the most elementary points of science even the points YOUR SIDE AGREES WITH!
All you do Marty is
https://coloradowellington.files.wordpress.com/2015/11/troll-shifty-and-speedy.jpg
but you keep coming back to post absurdities and ACCUSING Steven of posting the wrong graph, so we are left with pointing that out.
So AGAIN!
Tell me Marty, how much of the sea ice is in the ocean and how much is in the air?
Or don’t you even know that very very basic fact?
Let us not forget the Baltic states this week.
http://www.noodweercentrale.nl/de/wetter/profiwetter/stroemungsfilm/europa.html
http://cdn.fmi.fi/marine-observations/products/ice-charts/latest-full-color-ice-chart.pdf
Trend is Arctic Sea Ice volume is down:
http://psc.apl.uw.edu/wordpress/wp-content/uploads/schweiger/ice_volume/BPIOMASIceVolumeAprSepCurrent.png
There is currently more ice in the Arctic than the average of the past 9000 years. Why do you frauds always pick cold periods to start your graphs?
1- List all climate forcings, order them from most to least effectual, and then quantify them all.
2- Please provide even one peer reviewed paper that refutes natural variability as the cause of recent, or any, global climate changes.
There is nothing unusual or unprecedented about our climate, or how we got here. For 4,500,000,000 years climates have always changed, naturally. This means there has been a set precedent, and the burden of proof falls on natural climate change deniers like yourself.
Remember this from waaaay back?
cfgjd says:
December 9, 2015 at 3:27 pm
Submit to a Journal or it does not exist…simple rule.
So refutation of natural variability “does not exist”! 😆
After decades of HARD WORK resulting in posters in major symposiums, climate skeptics have not provided a good alternative explanation of why the planet is warming up now. The emperor has no clothes.
How is it that trillions of dollars and every alarmist scientist has failed utterly to refute the most obvious cause of climate change?
Paper please! 😆
Little man,the Arctic ice cover is above average for the Holocene,which for periods of time has little to NO ice in the summertime.
How is it that after decades of hard work and millions of dollars spent, Alarmists cant make a climate model work worth spit.
If the day is not cloudy, go outside and look up.
That chart is a model. It is not a chart of real data
https://i2.wp.com/s19.postimg.org/5vfcwbc8j/amoreyk.jpg
Now the flipped Arctic Sea Ice chart, starting at the BOTTOM of the CYCLE (1979) compared to the AMO.
https://i2.wp.com/s19.postimg.org/4crolmgmr/amo_vs_NHice.jpg
Now tell me cfgjd, how much of the sea ice is in the ocean and how much is in the air?
Trend is Arctic Sea Ice volume is down:
from an unusually high 1980
Again the moronic propaganda trick of hiding the rise since the AMO turned.
You are a SLIMY, DELIBERATE LIAR, cFool
PIOMAS shows Arctic sea ice volume increasing in line with the turning point of the AMO.
Heck you can even see it in the top graph of yours.
But let’s look at the whole data, instead of choosing a couple of months where it isn’t as blatantly obvious.
http://psc.apl.uw.edu/wordpress/wp-content/uploads/schweiger/ice_volume/BPIOMASIceVolumeAnomalyCurrentV2.1.png
It was pretty hard to get it to show up, and the alignment isn’t absolutely perfect…
but here is the flipped PIOMAS data date aligned with the AMO.
http://s19.postimg.org/vb9l3uj3n/amo_VSpio.jpg
Make up your own minds if the Arctic is strongly affected by the AMO or not.
Way up thread, AndyG55 said there was evidence of less sea-ice in the Artic during the 1940’s. One of those ‘pieces’ of evidence now resides at the Vancouver Maritime Museum, it is the RCMPV St. Roch.
http://i255.photobucket.com/albums/hh154/crocko05/RCMPVSTROCH_now_zps3eb42c26.jpg
http://i255.photobucket.com/albums/hh154/crocko05/RCMPVSTROCH_zps95d48657.jpg
In 1940-42 she became the first vessel to navigate the NWP from west to east (taking 28-months),
.
.
.
.
…… but wait! There’s more!
.
.
.
.
In 1944, she made the return journey, using the more northerly route …
.
.
.
.
… in just 86 days! Making it the first vessel to navigate the NWP in just one season and smashing any previous NWP records.
I wonder how many boats that size have made the voyage in the last couple of years, without icebreaker escort, of course.
It is not possible, even in theory, to rule out unknown causes, fairies, Jesus etc. as the reason for the recent planetary warming. Therefore we need to look at the evidence – what evidence is there that the recent warming is caused by internal variability in the climate system?
Ergo it is impossible to blame man for a perfectly natural act.
Eat dirt dummy. 😆
If you can’t even NAME the various factors effecting climate, you can not rule them out and THEREFORE YOU CAN’T BLAME MANKIND!
http://jonova.s3.amazonaws.com/graphs/lappi/65_Myr_Climate_Change_Rev.jpg
That says the dinkle shit amount of GoreBull Warbling isn’t even on the radar as far as climate change goes.
The error in temp data cannot exceed 0.5°C or else all these global temp indexes are statistically equal (i.e., no warming).
http://www.ncdc.noaa.gov/img/climate/research/global-jan-dec-error-bar-pg.gif
So what is the error in just the READING from the BEST temperature data set. That is the US temperature data.
http://www.surfacestations.org/Figure1_USHCN_Pie.jpg
Over 70% of the stations have an error greater than 2 degree C!
And that doesn’t even get into the bogus sampling techniques or the massive amount of missing data that is made up.
https://stevengoddard.files.wordpress.com/2015/01/ncdcafricafaking2.gif
Clearly the planet is warming up as the ice sheets in Greenland are West Antarctica are getting smaller, as are almost all mountain glaciers all over the world including the Antarctic Peninsula. Arctic Sea Ice volume is on a strong downward trend while oceans are warming up and rising. And oh yes, the fake hiatus in surface temps is probably over too.
Hey dumbass! NEWSFLASH! Ice melts!
We have just come out of the coldest period of the Holocene, so of course ice is melting. Duh.
And the fake hiatus was ended by fake temperatures. The real hiatus continues.
Still waiting on that paper cfool.
CFool says “Clearly the planet is warming up as the ice sheets in Greenland are West Antarctica are getting smaller”
>>>>>>>>>>>>>>>>>>>
MORE PROPAGANDA!
February 20, 2013 New paper finds Antarctica has been gaining surface ice mass over past 150 years
University of Texas News: Researchers Find Major West Antarctic Glacier Melting from Geothermal Sources
NASA In late September 2013, the ice surrounding Antarctica reached its annual winter maximum and set a new record.
http://eoimages.gsfc.nasa.gov/images/imagerecords/82000/82160/spseaicemax_extent_chart_2013.jpg
(This is what matters. A change in albedo.)
Robot Sub Finds Surprisingly Thick Antarctic Sea Ice
………………………
Study finds Arctic seabed afire with lava-spewing volcanoes: The Arctic seabed is as explosive geologically as it is politically judging by the “fountains” of gas and molten lava that have been blasting out of underwater volcanoes near the North Pole.
Sea Level Changes Past Records and Future Expectations
Ice free Arctic Ocean, an Early Holocene analogue
A new approach for reconstructing glacier variability based on lake sediments recording input from more than one glacier January 2012
The highest glacier growth started 600 years ago prior to that most glaciers had melted away.
Temperature and precipitation history of the Arctic
Mid to late Holocene sea-level reconstruction of Southeast Vietnam using beachrock and beach-ridge deposits
Translation the sea level was up to 1.5 meters higher than today in a tectonically stable area ~5000 years ago to 2000 years ago. Tectonically stable area refers to areas devoid of deformation such as all processes which modify the external form of the crust. For example unidirectional vertical movements, plate tectonics and also the rise and fall of the solid earth surface, especially in coastal areas, caused by external factors such as climate change (gio-isotasy, hydro-isotasy)
A little video for you cFOOL.
Do try to listen to ALL of it especially right toward the end.
https://vimeo.com/14366077
Wrong Gator. Skeptics nor anybody else have not been able to provide an alternative explanation for the warming. What are the cycles that caused the warming? Letäs look at the evidence…
Null Hypothesis. Ever heard of it?
cfgjd says:
January 7, 2016 at 3:46 pm
Wrong Gator. Skeptics nor anybody else have not been able to provide an alternative explanation for the warming.
=====
cf, if you were an honest broker…you would admit that no one has been able to provide an explanation for the warming…one way or the other
The theory you hold to has only worked in bits and pieces…and not the same pieces and not at the same time
Bingo! Another zealot outs himself by ignoring the obvious. There are really two main reasons why I ask alarmists to list all forcings, and disprove NV.
1- It is supposed to make them think.
cfool failed number one.
2- It is a means of separating the honest from the liars.
cfool has shown himself to be a liar.
Fence sitters can plainly see the dishonesty and obvious zealotry of the alarmists, and they become skeptics.
You’re right gator.
This blog and the many helpful links and responses to the AGW scam helped me see through the bull.
I don’t have the level of expertise as many of the people that post here and it has helped me to learn a great deal, for which I thank you all, even the devil’s advocates. You helped save at least one “fence sitter”.
Now I enjoy my furnace without guilt in winter. It’s great! I even invested in some fossil fuel companies since it’s been driven down so far by the market. Coal is only increasing in demand worldwide.
Climates change naturally. Everything we are seeing is perfectly natural, and you cannot prove otherwise.
Only an idiot would panic when the Sun rises on time.
“What are the cycles that caused the warming?”
Seriously.. don’t even know any of those?
wow.. no wonder you come across so darn ignorant.
You have serious research and learning to do, little child-mind.
“The argument favoring a geological origin to Greenland glacier ice melting is heating up, specifically geothermally.”
http://www.plateclimatology.com/greenland-ice-melt-geothermal-not-man-made/
Organic,
That is why the Alarmists are trying to muzzle any and all debate. They KNOW they would lose an honest debate.
Gail, cuz we know of course that the “science is settled.”
Debate between Marc Morano and Bill Nye the Science Guy, like the one I saw on John Stossel’s show, was revealing.
Nye couldn’t really get anywhere with the standard talking points and kept retreating back to the argument “the world once had 1 billion people and now it has 7 billion”. Morano asked Nye who he was to tell people in developing countries how to live while he sits in his ivory tower. Awesome! It reveals the real heart of the AGW mindset I think.
Interesting link lecdog…. that’ll upset a few of the more brain-washed trolls. 🙂
What is really really funny Gator is CFool is now saying
And yet I gave him that info DAYS ago.
https://s-media-cache-ak0.pinimg.com/originals/26/b4/88/26b48864de968ec90e84ad48c8d60b35.jpg
– what evidence is there that the recent warming is caused by internal variability in the climate system?
===
Problem is, we don’t know enough to know if it is….or isn’t
CFool says “Clearly the planet is warming up as the ice sheets in Greenland are West Antarctica are getting smaller”
>>>>>>>>>>>>>>>>>>>
MORE PROPAGANDA!
February 20, 2013 New paper finds Antarctica has been gaining surface ice mass over past 150 years
University of Texas News: Researchers Find Major West Antarctic Glacier Melting from Geothermal Sources
NASA In late September 2013, the ice surrounding Antarctica reached its annual winter maximum and set a new record.
http://eoimages.gsfc.nasa.gov/images/imagerecords/82000/82160/spseaicemax_extent_chart_2013.jpg
(This is what matters. A change in albedo.)
Robot Sub Finds Surprisingly Thick Antarctic Sea Ice
………………..
Study finds Arctic seabed afire with lava-spewing volcanoes: The Arctic seabed is as explosive geologically as it is politically judging by the “fountains” of gas and molten lava that have been blasting out of underwater volcanoes near the North Pole.
Ice free Arctic Ocean, an Early Holocene analogue
A new approach for reconstructing glacier variability based on lake sediments recording input from more than one glacier January 2012
The highest glacier growth started 600 years ago prior to that most glaciers had melted away.
Temperature and precipitation history of the Arctic
Validation by other methods.
Sea Level Changes Past Records and Future Expectations
Mid to late Holocene sea-level reconstruction of Southeast Vietnam using beachrock and beach-ridge deposits
Translation the sea level was up to 1.5 meters higher than today in a tectonically stable area ~5000 years ago to 2000 years ago. Tectonically stable area refers to areas devoid of deformation such as all processes which modify the external form of the crust. For example unidirectional vertical movements, plate tectonics and also the rise and fall of the solid earth surface, especially in coastal areas, caused by external factors such as climate change (gio-isotasy, hydro-isotasy)
cfgjd,
Tell me how much of the sea ice is in the ocean and how much is in the air?
WAIS is losing mass quite rapidly…it can be clearly seen with both GRACE and altimetry. The big ice streams are acting up…
Eventually you will be like the person in the mental hospital who insists he is Napoleon. I wonder what you will do once it is impossible to credibly deny that any warming that had recently taken place is over and if anything cooling is happening now. Depending on how strong your mind is, you could go crazy as a result.
The idiot can not even READ!
The West Antarctic Ice Sheet (WAIS) is melting because of Geothermal activity.
Here it is AGAIN!
University of Texas News: Researchers Find Major West Antarctic Glacier Melting from Geothermal Sources
And more Huge Underwater Volcanoes Discovered Near Antarctica: Leat’s biologist colleagues discovered some interesting creatures living in the hot-spring-like conditions near the underwater mountains,
The place is full of geothermal activity.
https://news.wustl.edu/news/PublishingImages/Picture1%20copy.jpg
Obviously, if the US is cooling it is only 2% of the earth’s surface and therefore should be discounted. On the other hand if the West Antarctica Ice Sheet is losing mass from geothermal warming, then that 1% of the earth’s surface proves that global warming is taking place.
Dude even NASA resident ice guru concludes GRACE is an outlier! Most of the loss is in GIA adjustments. The ICEsat laser satellite shows the Antarctic is gaining mass. Frezzotti et al 2012 also came to the same conclusion.
Nope, everyone agrees that WAIS is losing mass rather rapidly as the signal is so strong, the jury is still out on EAIS, even though most scientists estimate that Antarctica as a whole is losing mass.
Gonzo,
You will notice the usual Alinsky tactic of the trained Propagandist.
WE have to produce peer-reviewed studies. (Which are then completely ignored) While CFool only has to make stately pronouncements from his pedestal atop the Moral High Ground.
cfgjd,
Tell me how much of the sea ice is in the ocean and how much is in the air?
So cf, by your logic if the US is gaining population overall yet one state is losing population then the whole of the US losing population. Genius!!
Yeah it really looks like WAIS is losing ice radiply. NOT
http://climate.nasa.gov/system/internal_resources/details/original/636_figure-dmdt-map-768px-80.jpg
As I said it is losing ice in certain spots due to GEOTHERMAL ACTIVITY.
You know volcanoes, hotsprings and the like. And that map shows it.
(Thanks Gonzo, not that the warmist can add 1=1 and get 2.)
If its just the Western Peninsula.. its certainly NOTHING to do to with GLOBAL warming.
Its so hilarious to see them focus on one small (relatively) area that just happens to be over a strong volcanic region, and try to link it to “global” anything. Dumb is as dumb does. !!!
There’s a place toward the tip of the peninsula where the thermal springs are warm enough for it to be designated a tourist destination.
And of course the life-sustaining benefits of these warm springs in the Antarctic provides for so strange sites..
http://news.discovery.com/earth/oceans/antarctic-deep-sea-vent-creatures-010312.htm
cfgjd,
Tell me how much of the sea ice is in the ocean and how much is in the air?
This graph of southern sea temps explains the melting in the Antarctic..;-)
https://bobtisdale.files.wordpress.com/2015/04/14-southern-ssta.png
Fantastic Andy, you deserve a medal. I specifically said “at depth” in order to discourage morans equating SST with ocean temperature.
Yeah Andy, at depth, where thermal vents hide Trenberth’s missing heat.
Hello again, Mr fact free zone.
Ah, those imaginary warm currents. 😉
http://oceanservice.noaa.gov/facts/coldocean.jpg
I can see it creeping on tippy-toes along the ocean floor , making sure nobody can find it.
So CommonFool gjd
Tell me how much of the sea ice is in the ocean and how much is in the air?
And what really amazing is that it is clever enough to mix itself in with the volcanic thermals …. .as a disguise, obviously !!…
….but only under the West Antarctic peninsular, and nowhere else on Antarctica
HEY Common Fool gjd
READ!
A 13 year old should know this!
‘…how much of the sea ice is in the ocean and how much is in the air?’
LOL levitating sea ice 😉 need a pic for that
They’re only a handful of areas in the far north of the Peninsula that are above freezing
in the summer, the rest of the Antarctic is well be low freezing. Current SST anomalies show the straight btwn S America and the tip of WA are well below normal right now.
earth.nullschool.net/#current/ocean/primary/waves/overlay=sea_surface_temp_anomaly/orthographic=-89.39,-87.18,497
Gail sometimes the salt extrudes to the surface and makes Ice Flowers which contain a lot of salt. http://www.polarmicrobes.org/?p=106
Morgan Wright says “You can’t argue with Demon-crats. They don’t care about the truth they only care about politics.”
Those Demons are spooky, especially the Succubus like this one.
http://www.sott.net/image/s14/293250/medium/clinton_lies.jpg
cfgjd says: “Find me a glaciologist who agrees that the recent acceleration of big ice streams in WAIS is caused by “geothermal activity”? I don’t think you can, as in situ measurements clearly show that the culprit is warmed ocean water at depth.“
>>>>>>>>>>>
Are you REALLY REALLY that devoid of reasoning ability that someone with a PhD has to tell you what to think?
I will lead you by the hand since you obviously can’t think on your own. (Papers referred to are HERE)
1. Science papers show geothermal activity and volcanoes on both the land and in the sea near Antarctica.
2. “geothermal activity” MELTS ice. DUHHhhhh!
3. Ice with a coating of water is slicker that goose shit.
4. Any glaciers heated from below will therefore slide faster.
>>>>>>>>>>>
You are saying the cause is “the culprit is warmed ocean water at depth.”
>>>>>>>>>>>
Does that pass statement pass the sniff test? NO!
Again science papers/NASA show.
1. Record Antarctic sea ice for last couple years.
2. Sea Ice thicker than thought.
3. Current sea surface temps show Antarctic Circumpolar current is cooler than average even though it is summer.
http://weather.unisys.com/surface/sst_anom.gif
4. Thermohaline circulation
Thus GEOTHERMAL is the likely cause no a fairy tale of phantom warm water deep in the ocean.
Gail,
This is completely OT but is more support for your contention that women suffer more injuries in combat jobs than men:
http://www.strategypage.com/htmw/htinf/articles/20160107.aspx
Notice this little gem:
“Speaking of physical standards, this has become a problem for European countries now seeking women for the infantry because it is a known and accepted fact that women suffer more injuries in physically stressful activities. Proponents of women in combat (none of them combat veterans) dismiss these issues as minor and easily fixed but offer no tangible or proven solutions. By European law allowing women in jobs that leads to more injuries than men would suffer is illegal. No one has gone to court over this yet but it is only a matter of time. First you have to wait for enough women to join to get a statistically valid number of injured female infantry.”
Thanks RAH,
No one disputes the fact that a stallion is stronger than a mare and very very few fillies have won races against colts. The US government recently made a law that you can not have children around stallions, bulls, boars, rams or bucks. Any farmer will tell you an uncut male is stronger and more aggressive. It is for this reason we neuter farm animals. Pound for pound you get more muscle mass to fat in males and skeletal differences allow the identification of make vs female skeletons.
To put it bluntly the males of most species have evolved with the best fighters getting breeding privileges so you get a differentiation in body type and aggressiveness between males and females. Stupid Progressive laws aren’t going to change things.
Of course if you want to markedly decrease the population, you toss females as well as males into combat and then start a bunch of wars…..
“Of course if you want to markedly decrease the population, you toss females as well as males into combat and then start a bunch of wars…..”
Ouch! I am not saying you are wrong, I am saying that it makes too much sense to discount the possibility.
Jason,
I am not sure how true it is but the folklore I was told by my mother was repeated heavy lifting caused internal injures that made childbearing difficult. SEE: link
As far as wars go, it sure looks like Clinton and Obummer have been busy little bees in setting up the next set of wars for Ike’s military–industrial–congressional complex to profit from.
Excluding the rain/snow events, the SW is still in a permanent drought.
Find me a glaciologist who agrees that the recent acceleration of big ice streams in WAIS is caused by “geothermal activity”? I don’t think you can, as in situ measurements clearly show that the culprit is warmed ocean water at depth.
How about you find me a glaciologist who accredits ice streams to melting ice. I went to this page here: http://www.antarcticglaciers.org/modern-glaciers/ice-streams/ and it seems to me that topographic and geologic structure seems to have all the influence on these “streams”.
Ocean water can melt and thin the ice-shelves from below (” at depth”), which causes ice stream grounding-line retreat, which causes glacier speedup, which causes mass-loss. No surface melting needed.
You mean these ocean temperatures..??
https://notalotofpeopleknowthat.files.wordpress.com/2014/05/14southernssta.png
Bullshit.
“ice streams” have nothing to do with thinning ice shelves. It is the natural mechanism for ice to move to the sea from inland antarctica.
Isn’t it amazing….they know what’s happening in places that no one can go look
HOW TF can ocean water temperature affect land bound ice?
Teleconnection.
🙂
Besides, the southern oceans have been cooling.
[in situ measurements clearly show that the culprit is warmed ocean water at depth.] You can’t even get that right! The culprit is a shift in the circumpolar winds bringing warmer SURFACE water from the Indian Ocean allegedly eating away at the ice sheet from underneath.
Find me a peer reviewed paper that agrees that NV has been refuted. I know you cannot, and know that you will continue to lie about man being responsible for a natural cycle.
Paper please!
cfgjd,
Tell me how much of the sea ice is in the ocean and how much is in the air?
“The above geological information clearly shows that the Larsen B Ice Shelf is located along an active geological system known as the West Antarctic Rift System. NASA’s failure to at least mention this fact and the probable influence of associated geothermal heat flow concerning the sudden changes in the Larsen B Ice Shelf is truly remarkable.”
http://www.plateclimatology.com/how-geologic-forces-are-melting-the-antarctic-larsen-b-ice-shelf/
“Those supporting the global warming theory, NASA, NOAA, IPCC, and the Obama administration, have flooded the media with reports that rapid West Antarctic glacial melting is clearly and unequivocally caused by man-made global warming of the oceans and atmosphere.
Overwhelming amounts of credible evidence strongly indicates, if not proves, that geologically induced heat flow from the West Antarctic Rift System is melting glaciers from beneath. Rift System faults provide a conduit to deep mantle heat. This is the key geological component that fuels Mount Erebus, and numerous other Antarctic heating events.”
http://www.plateclimatology.com/antarctic-volcano-mount-erebus-wakes-up/
This is how NASA prefaced Zwally’s recent paper.
[NOTE: The findings reported here conflict with over a decade of other measurements, including previous NASA studies. However, challenges to existing findings are an integral part of the scientific process and can help clarify and advance understanding. Additional scrutiny and follow-up research will be required before this study can be reconciled with the preponderance of evidence supporting the widely accepted model of a shrinking Antarctic ice sheet.]
Surprising they even let him publish! Notice they say “accepted model”. I guess actual measurements from both Zwally and Frezzoti aren’t good enough. The models are all seeing
https://image.slidesharecdn.com/agu14v3-150703221013-lva1-app6891/95/complex-antarctic-iceshelf-height-changes-revealed-by-eighteen-years-of-satellite-radar-altimetry-12-638.jpg
So you’re saying the same tech that maps ocean floors and the worlds topo can’t measure/map the Antarctic ice sheet. More GENIUS.
So ice never melted before the 20th century? Is that your point?
What percentage of Antarctica is the volcanicly active wais?
That is a slidenet slide
Ingrid LE RU, International Projects Coordinator
A bit of FOLLOW THE MONEY!
The website image.slidesharecdn.com is expected to be earning an estimated $11,581 USD on a daily basis.
So from an Activist group supported by the French Government and a bunch of corporations.
Also notice CFgjd probably stand for Common Future plus actual initials.
No wonder CFool is so brain dead and refuses to actually post any info.
Didn’t want to give away you affiliation did you CFool?
Ein future, ein volk, …
Link. I can type better than that.
Oct. 30, 2015
NASA Study: Mass Gains of Antarctic Ice Sheet Greater than Losses
A new NASA study says that an increase in Antarctic snow accumulation that began 10,000 years ago is currently adding enough ice to the continent to outweigh the increased losses from its thinning glaciers.
The research challenges the conclusions of other studies, including the Intergovernmental Panel on Climate Change’s (IPCC) 2013 report, which says that Antarctica is overall losing land ice.
According to the new analysis of satellite data, the Antarctic ice sheet showed a net gain of 112 billion tons of ice a year from 1992 to 2001. That net gain slowed to 82 billion tons of ice per year between 2003 and 2008.
http://www.nasa.gov/feature/goddard/nasa-study-mass-gains-of-antarctic-ice-sheet-greater-than-losses
Lat
They won’t pay attention to that. A while back I showed them two recent studies the showed Antarctic and even the western ice shelf were gaining ice, including the one you present here. They refused to even acknowledge those studies.
The old DMI-graph is crappier than the newer one, which they clearly state. That is normal, get over it.
My, my! How desperate are the alarmists?
The old DMI-graph is crappier than the newer one, which they clearly state.
Please provide the page that clearly states that the 30% graph is “crappier” than the new “crappy” graph.
https://www.youtube.com/watch?v=PsdANnHWMCA
The old DMI graph is not “old” in the sense that kept current. And according to DMI right on the page with that “old” graph it says:
” The shown sea ice extent values are therefore recommended be used qualitatively in relation to ice extent values from other years shown in the figure.”
Comprehend much? Let me spell it out for you! That “old” graph is the one that DMI says should be used for comparison to past years! And that is exactly why and how Steven uses it.
So you wanna argue with someone about using that graph then you should be arguing with the SOURCE of the graph and not the users, such as Steven, who are just following the recommendation for the graphs use stated by the SOURCE.
Get it?
No, he does not, and will not ever get it. Self imposed ignorance is impenetrable.
Gator, it is not ignorance it is AGENDA. That is Agenda 21.
CommonFuture Fool gjd is trying to shove the debate OFF climate and onto “consolidating the scientific basis for assessing risks and options for action, to defining the form that action has to take in order to engage in a necessary transition to low-carbon and adapted economies and societies. For stakeholders, the question has shifted from reasons for action to the form action has to take.” And we and well over 50% of the population are holding back Progress (towards our own enslavement.)
Common Fool gjd is selling snake oil for Our Common Future under Climate Change Organization
When someone ignores all evidence and refuses to engage in debate you can guarantee they have a hidden agenda.
Notice that those scenarios were WRITTEN by lead author Ged Davis VP OF SHELL OIL!