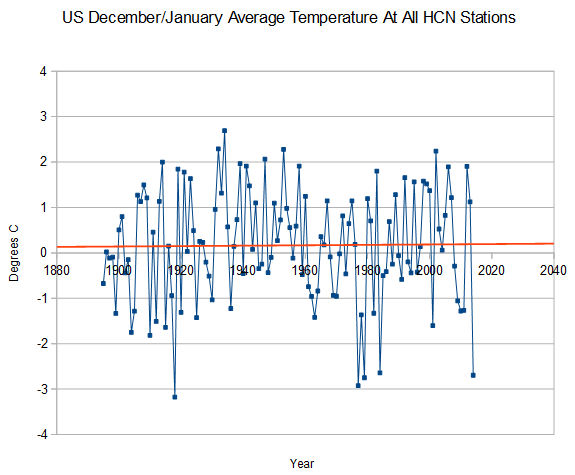
December/January so far, is the coldest in the US in 35 years and 4th coldest on record, with no trend since 1895.
Index of /pub/data/ghcn/daily/hcn/
lf I plot the 4-5 temperature minima, the slope is positive with time. That’s a sure sign of global warming. You have to understand which data are important. 🙂
57 below zero F in Montana. January 1950. http://trove.nla.gov.au/ndp/del/article/104333634 Crikey you guys must have brass ones to survive in that weather!
You might want to retract this post, Skeeter may use it as proof of global warming.
You call that no trend?! Why, in only another 85,000 years we will have crossed the two degree rise and reached a tipping point! Disaster!!
Your email address will not be published. Required fields are marked *
Comment *
Name *
Email *
Website
Save my name, email, and website in this browser for the next time I comment.



lf I plot the 4-5 temperature minima, the slope is positive with time. That’s a sure sign of global warming. You have to understand which data are important. 🙂
57 below zero F in Montana. January 1950.
http://trove.nla.gov.au/ndp/del/article/104333634
Crikey you guys must have brass ones to survive in that weather!
You might want to retract this post, Skeeter may use it as proof of global warming.
You call that no trend?! Why, in only another 85,000 years we will have crossed the two degree rise and reached a tipping point! Disaster!!