
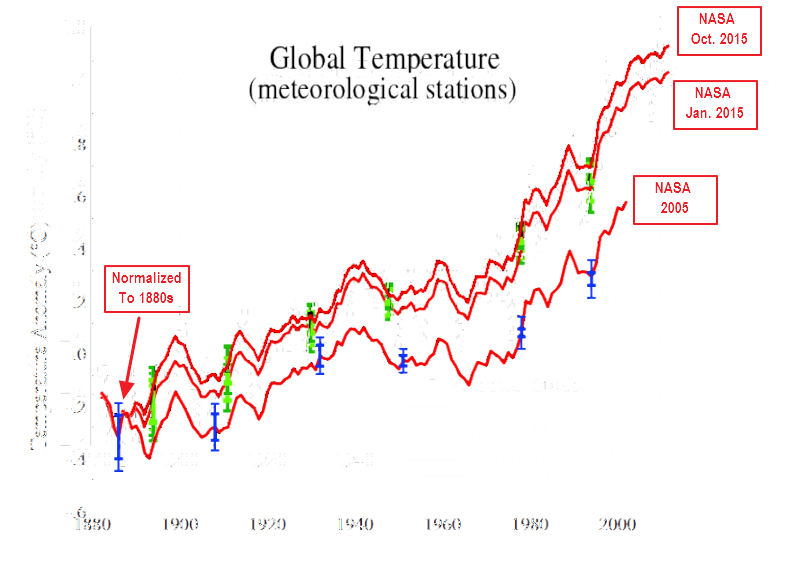
I’m trying out some new ways to help people visualize how NASA data tampering has nearly doubled 1883-2003 warming since 2005, and how they made the hiatus disappear in 2015.
The next graph shows only the five year means at the same scale, but normalized the three graphs to the 1880s. Note how they have adjusted the data nearly an order of magnitude out of their own error bars. A smoking gun of incompetence and fraud by the criminals who are behind the biggest scam in history.

Colorado University’s Sea Level Research Group has a similar record changing sea level data.
http://oi59.tinypic.com/24e8482.jpg
And of course the actual sea level rate is probably around 1.5 – 1.8mm/year.
About half what UC are fabricating.
Still even at 3.2mm/year.. how SCARY is that ! 😉
Steve — Instead of overlaying graphics files, can’t you reproduce each graph with the original data? That would make these more convincing.
Steve — Instead of overlaying graphics files, can’t you reproduce each graph with the original data? That would make these more convincing.
And why are these adjustments being constantly made? If you ask, you’ll find their reasoning is veiled in confidentiality in order to protect their scientific integrity. But seriously, I’d like to hear from them why the continuous adjustments, and re-adjustments are being made. Talk about torturing the data!
Hey gregole! That is the $100,000 question. Actually, that is the $100 billion dollar question — and it is the one question that the CAGW faithful don’t even see as an issue. The official statistics keep changing and morphing. Year after year, the climate history shifts and what was is forgotten and replaced by what they are telling us today. What was one measurement when the scientists spoke ten years ago has now mysteriously become something different and no one can explain how or why it changed. When pressed, there may be some vague and completely unverifiable response like, “we changed our adjustment algorithm to better account for time of observation errors”, or “the new program is more aggressive at detecting and correcting for outliers and transcription mistakes.” Translated into more common language, both those so-called explanations can be given as “we changed the numbers but we are not saying what our criteria were or by how much we altered them. We did what we did, and we did it on purpose.”
How can the CAGW faithful not see through the vague response? Tony points out the smoking guns over and over and over, but how to the warmists respond? “But, but, but, they are SCIENTISTS! How can YOU be right when all the SCIENTISTS say different?!”
Warmists are like a four year old child who jerks his arm away when the doctor tries to bandage a wound. “Mommy! The bad man is hurting me! Make him go away!”
Don’t take this as trying to justify their scam, but that’s just how governments do things. If you look at their equally fraudulent (possibly even more so) economic numbers, you see the exact same pattern. When they released the third quarter GDP this week, they didn’t just calculate the economic activity for the previous three months. They went back to the very beginning of their data base, I believe in the 30’s, and recalculated the entire history. They do this, oddly enough, for consistency. They don’t care about consistency from one report to the next. What they care about is the internal consistency within each report. Every quarter they come up with some new theories about what should be counted differently. In order to keep everything internally consistent, they have to recalculate the entire series with the new assumptions, every quarter. If you compare this GDP report to the last one, you’ll find all the same things that Tony points out to us about the temperature record. A common one is seeing an increase, to a number LOWER than that from the previous report. A few years ago, that was the norm on the jobs reports. 150,000 new jobs this month, but revisions in the previous 3 months totaling negative 230,000. Adding those 150,000 jobs brought us to a level that’s 80,000 lower than we had in the previous month. It’s all because their goal is consistency within reports, not between them.
I’m guessing that the same process is used for temperature reports. Of course, for both temperature and GDP, the government’s interests coincide with those numbers increasing as fast as possible. As such, some new measurement assumptions are politically favored over others. It’s not likely there’s some Dr. Evil, cranking up the adjustments as fast as he thinks he can get away with it. It’s a committee, voting on which new assumptions are proper, and which aren’t. And that committee, being human, has a particular result they’d prefer. It may only be subconscious. They just look a little harder for reasons to justify adjustments in the favored direction. Run that cycle enough times, and the whole data set steadily drifts away from reality.
Now you got me started Ted. Think about this only if your heart condition is good.
Reported GDP for 2014 = $17,420 Billion & 2013 – $14,100 Billion
For 2014 total Fed Govmt spending = $3,504 Billion of which $483 Billion was borrowed. $483/17,420 = 2.77% of GDP is the Fed’s spending borrowed money out of 2014’s 2.4% growth.
For 2013 total Fed Govmt spending = $3,509 Billion of which $690 Billion was borrowed. $690/$14,100 = 4.9% of GDP is the Fed’s spending borrowed money out of 2013’s 2% growth.
http://www.heritage.org/multimedia/infographic/2014/12/the-federal-budget-1994-2014
Since the Feds spent this money, that means 2.77 percent and 4.9 of our GDP was spending borrowed money and shows up as current growth in GDP. When it is paid back, it is not considered GDP and no effect is made. So not only are the Feds putting your kids and grandkids in debt, they are stealing their GDP growth.
Now look at some of the fudging going on with other factors going into GDP, since all growth over the last years has been on borrowed money.
In this chart, PCE dwarfs everything else. If you just look at the BEA’s numbers you see that personal consumption expenditures in the second quarter were running at a $10 trillion annual rate, 70.7% of the $14.1 trillion GDP figure.
Third category of PCE—“imputed services.” What this means is that the BEA assigns a number to certain economic activities, even though no money actually changes hands. The two most important imputed services are “imputed rental of owner-occupied nonfarm housing” and “financial services furnished without payment”. Respectively, these are the money you supposedly pay yourself to live in your own home, and the money you supposedly pay the bank for such services as free checking (by accepting lower or no interest on your demand deposits).
This category—worth $1.5 trillion or 11% of GDP
http://www.businessweek.com/the_thread/economicsunbound/archives/2009/08/get_it_straight.html
Are you saying you didn’t know that over 10% of GDP is a rent payment on the portion of your paid for house and free banking services? It does.
Only Government accounting has more made up numbers than AGW & climate change.
Madness!
I read (maybe two years ago) that some Chinese economists were estimating that perhaps as much as one third of the US GDP was actually based on various financial transactions which did not produce either actual goods or real services.
There is an old joke… Two economists are shipwrecked on a desert island. At the end of the first year they are starving, have no hut, no raft, not even a fishing net — but have both become millionaires by selling a coconut back and forth between themselves.
Ted, I suspect that you are exactly correct about the modification system set up to massage the temperature record. That sort of thing is merely wrong if done by the sincere but ignorant. However, it is fraud when a group of scientists do it. Why? Because scientists know better. Scientists are trained to look at things differently and more rigorously.
I am not a Doctor. If I advised someone to eat arsenic to cure a headache it would be stupid, but arguably only manslaughter. If a trained medical professional, a Doctor, gave the same advice, it would be murder.
IMO, anything before 1979 in the way of temperature measurements has been made irrelevant and untenable by the massive tampering evidence with the data.
Would be interesting would be how much pseudo-warming they have CREATED since 1979 and the comparison with RSS/UAH.
Tony, this was a good idea but it would work even better if you include links to the original pics as you did here: http://realclimatescience.com/2015/10/more-off-scale-fraud-by-nasa/
BTW, you might also find use for this line: “If you torture the data enough, nature will always confess” written by Nobel Laureate (economics) Ronald H. Coase in “How should economists choose?” Warren Nutter Lecture, 1981. Reprinted in Essays on Economics and Economists (1994/2012)
https://en.wikiquote.org/wiki/Ronald_Coase
Send this entire posting with supporting data to Lamar Smith. its the smoking gun of fraud
How does it show fraud? It shows the data has been adjusted, but these datasets are all adjusted. No one disputes the data have been adjusted.
They do not admit to adjustments of anywhere close to this.magnitude,well beyond there error bars, and we’ll beyond the error bars of the flatlined satellite data sets.
Haven’t you simply shown that data has been adjusted? No one disputes that. All the datasets have been adjusted. And “tamper” is certainly a synonym for “adjust,” but to tamper with the data implies wrongdoing, and you haven’t shown wrongdoing; you have simply shown adjustment, which no one denies. You have to show that one or more adjustments is wrong. I don’t think you have even tried to do that. You are simply showing the difference between the data before the adjustment and the data after the adjustment and claiming there has been unethical conduct. Unless you show the adjustments are wrong, you are the one guilty of unethical conduct by providing no evidence that anything has been done wrong.
Hey Martin! “Unless you show the adjustments are wrong, you are the one guilty of unethical conduct by providing no evidence that anything has been done wrong.”
Martin, you write like an intelligent person — but you do not seem to understand how science works. Transparency is fundamental to science; science depends on “showing your work”. In science, any adjustments (ANY adjustments!) which are not clearly explained and justified are unethical. It is up to whomever changes the data to explain clearly — so clearly that other people can duplicate their adjustments — why and how they have changed the data. If NASA does not tell what their adjustment procedure is, then NASA is not practicing science and their charts are not simply worthless, they are worse than worthless because they cloud the issue.
In this case, Tony (and others) have gone even farther than showing that the adjustments are bad science. By showing the long term and essentially monotonic warming trend to the adjustments they have demonstrated that the adjustments are not even reasonably explained as honest (but incompetent) error. Fraud is the most reasonable explanation.
In science, unexplained adjustments are unethical. Unexplained adjustments are tampering. Unexplained adjustments are fraud.
Martin, I think you are a bright person, but do you really not see what I am pointing out?
Jason, the changes are transparent. They are clearly explained, and they are peer-reviewed. The raw data and the explanations for adjustments are publicly available. Here is one aggregation: https://tamino.wordpress.com/climate-data-links/
“In this case, Tony (and others) have gone even farther than showing that the adjustments are bad science.”
No one has shown anything of the kind. What has been shown is that the data have been adjusted, but no one disputes that fact in the first place.
“Martin, I think you are a bright person, but do you really not see what I am pointing out?”
Thank you, I am a bright person. That’s how I am able to see that neither you nor Steven Goddard is point out anything other than the obvious fact that the data have been adjusted.
“Jason, the changes are transparent. They are clearly explained, and they are peer-reviewed.”
Ah, that must be why NOAA are refusing to produce the “transparent, clearly explained, peer reviewed” evidence despite it having been requested by a House investigation subcommittee.
Glad we’ve got that sorted.
“Thank you, I am a bright person.”
There are some, based on the content of your posts, who would take issue with that.
Big style.
So by your logic, if I am selling you something by the gram, and I put my thumb on the scale, I have done nothing wrong. In that case, I have a lovely pile of BS for you! Oh sorry, I see you have already made your purchase.
That’s not my logic, gator. You have to prove that NASA put its thumb on the scale. At this point, no one has offered any evidence of that.
Martin, there are 30,000 blog posts here with huge amounts of evidence. Do some reading before you shoot your mouth off.
BS. Tony has shown the thumb on the scale. How stupid are you?
Who is Tony? Isn’t the author’s name Steven Goddard? I assume we’re talking about this blog by Steven Goddard. What is the evidence that this adjustment to the data is incorrect>
You ignorance is showing again! 😆
I haven’t claimed to have any special knowledge here, so calling me ignorant is again just stating the obvious. I’m asking for the evidence that shows the adjustment to the data that is the subject of this post is incorrect. The clear implication of the blog post is that the adjustment to the data is wrong. What is the evidence that the adjustment is wrong?
Cooling the past, and warming the present is fraud. Period. Weathermen do not change past readings to “improve” their forecast abilities, because that would be fraud. When profiteers are changing historical data to make more money, that is called fraud.
gator, now you are claiming that the adjustment is incorrect, even fraudulent, because the result didn’t go your preferred way. That’s not evidence of anything except, of course, that it made you angry.
Yes, the adjustments went the “preferred way” of the trillion dollar climate change industry, and against the data and the historical record.
How stupid are you?
Start your education here:
https://stevengoddard.wordpress.com/2015/10/30/glaciers-prove-nasa-temperature-fraud/
I have addressed that blog elsewhere, Steven. It doesn’t stand to reason. You are claiming the global average temperature is wrong because there were glaciers melting during a cold year. If that’s what you call evidence of incorrect adjustments, then you don’t have any evidence of incorrect adjustments.
Hey Martin! “You have to prove that NASA put its thumb on the scale.”
No, we all agree that NASA has put its thumb on the scale! The question is, “why have they put their thumb on the scale and by how much have they altered the reading.” NASA may (perhaps) have a very good reason for the thumb. “Your purchase needs to be shipped, and the thumb is to compensate for the tare weight of needed packaging” or “we have discovered that this particular scale is known to weigh too light by 20 grams, so we put our thumb on the scale to compensate” or even “we were weighing this in an elevator and it just started to move downward so we used our thumb to adjust for for the acceleration.”
We all agree (and you have pointed it out) that NASA has adjusted the data. We are faced with questions such as:
1) Have they given valid reasons for the adjustments? (In my opinion, certainly some of their reasons are valid.)
2) Have they given reasonable (and reproducible by other scientists) procedures for estimating the various adjustments? (The answer here, in my opinion, is no.)
3) Have the adjustment estimations then been carried out correctly and presented correctly, i.e., can we check their work? (We cannot check their work.)
Of course I may be wrong — so here is a simple example that will give you a chance to show that I am in error. In the 2005 chart from NASA, it shows 1880 with a 0.5 degree anomaly and an error range of about + or – about a tenth degree. In 2015 the anomaly has been changed to about 0.45 degree, well outside the earlier error range. Please tell me, what new information has been collected about the readings from 1880 that justify changing the anomaly by an amount three and a half times greater than its original error bars? Show your work.
I am a little embarassed about asking you to “do my homework” but I and a lot of people much smarter than me have looked for years and have been unable to find a clear justification and a reproducible algorithm for the changes. (And yes, I followed your link to Tamino’s site and have visited many of the links there in the past but have never found answers to questions like those above.) Just one simple example — that is all I am asking. If you can convincingly explain (show your work, no hand waving, no appeals to authority) why 1880 was changed by 3.5 times its error bar I think I will be well on the road to understanding NASA’s changes.
Sorry Martin, there is a typo in my post. The 1880 anomaly is about -0.1 degree, not 0.5 degree. My apologies, please ask if there are any confusing bits in my comment.
I can’t answer your questions, Jason. I don’t have the tools or the knowledge. But my inability to do your homework, as you put it, doesn’t mean anything. Nor does your inability to get your answers justify the claim that the adjustment is wrong, let alone that it is fraudulent.
Your reading and thinking skills appear to be extremely limited, Martin
Perhaps they are, but that doesn’t matter. You claim the global average temperature graph is wrong because there were melting glaciers in the coldest year, 1911. But that coldest year was -0.4C colder than the average used to compute the anomalies in the graph, which, If I’m not mistaken, is about 14C. That means the global average temperature for 1911 was about 13.6C, which is way warm enough to melt glaciers. So if I have misunderstood your analysis, what did I get wrong?
Hey Martin! First, let me thank you for your civility, even though we disagree on this subject. Many of us (on both sides of the issue) have encountered such anger and insults over the years that we tend to fall into name calling rather quicker than we ought.
“Nor does your inability to get your answers justify the claim that the adjustment is wrong, let alone that it is fraudulent.”
I am, of course, disappointed, but not surprised. I have been asking the same sort of question of CAGW supporters for years and always — ALWAYS! — get a similar response. If I may paraphrase you, “I can’t answer that question, but I am certain that the scientists have it right.”
If it was only me, or only a small handful with such an inability, or even if the subject were esoteric, I would agree. String theory? I read some books on it, understood a little for a while, but I have no illusions that I will ever understand it deeply. I can live with that. I may not understand enough to know whether it is right, wrong, or not even wrong, but I would never think that the physicists involved were fraudulent. Suppose, on the other hand, that I studied the (much) higher math involved, developed some interest in string theory, and began to ask questions about it. Suppose the reputed experts in the field told me that there were certain critical parameters in the equations but that they would not reveal how they arrived at their values. Looking over the literature, suppose I saw that there was a clear pattern over a long time that they were changing their parameter values arbitrarily, without explanation, and that the result each time was to support their own theory (and continue funding.) Once, twice, maybe three times I would probably let it slide — but eventually, lacking a clear reason and procedure for the ongoing modifications to the equations, I would get suspicious. VERY suspicious after ten or twenty years.
That is pretty much the situation I see with the global warming meme.
Thanks, Jason. Your paraphrase is a bit wrong. I am not certain that the scientists have it right. Even the scientists aren’t certain they have it right. The keep discovering errors, and they correct them. That’s what happened in this case. You are claiming not that the changes are arbitrary. That’s not true. The reasons for changes that I have seen are clear, so I am mystified that you are suspicious.
Sorry, small typo: You are claiming NOW that the changes are arbitrary.
Hey Martin! Glad to see that I am not the only person who still makes typos. 🙂
“You are claiming now that the changes are arbitrary. That’s not true. The reasons for changes that I have seen are clear, so I am mystified that you are suspicious.”
Yes, I think they are arbitrary. Without a clear explanation of why and how the changes are made, that seems to fall pretty strongly in the “arbitrary” category. Suppose a climatologist goes to the grocery store and buys apples instead of oranges. Is that decision arbitrary? Maybe, maybe not. I have no way of knowing. Maybe the store was out of oranges and even though the guy wanted oranges he had to settle for apples. In that case his decision was not arbitrary at all. He was constrained!
It is not the same way with science. Science does not get a free pass just because “I have no way of knowing.” Part of the procedures of how science works is that every theory, every interpretation, is constrained by the data — and any changes to the data absolutely, positively MUST be explained and justified or what is being done is not science. Are the changes to the historical record by NASA correct? Does their new chart more closely correspond with what an accurate instrument would have read in 1880? We have no way of knowing because there has been no clear explanation given for the change. (And these days, “clear explanation” includes releasing all pertinent software.)
I have read any number of warming supporters claim that the reasons for changes are clear, but I have never found them to be clear enough to be reproducible. Without that clarity, their charts are nothing more than assertion, no better than me asserting that no, it is in fact cooling, not warming.
As for the suspicion of fraud… This is an important point, so PLEASE bear with me a moment. I do, in fact, have the opinion that the climatologists are frauds. As a general rule, sceptics do not disbelieve the climatologists just because they think the climatologists are fraudulent. There are two very distinct, very different subjects involved. Sceptics disbelieve the climatologists because the SCIENCE is bad. We see major failures in the science, so we do not believe the climatologists who promote it. The subject of whether the climatologists are fraudulent is completely secondary to whether the science is correct. It is possible that the climatologists could be simply wrong and thus put out bogus science. (In which case I would be right about the science and wrong about the psychology of the climatologists.) It is even possible that the climatologists could be criminals who put out accurate science. (In which case I would be right about the climatologists and wrong about the science.)
So, why do I think that NASA is not just wrong, but lying? It is the pattern of error which I see, a pattern which to me indicates a series of mis-statements which invariably adds to the credibility of their theories and their statements. Additionally, many of their errors are such that it is difficult to imagine even an incompetent scientist repeating them over and over. I will illustrate. They have for decades now, been adjusting charts in such a way that the overall warming for any given period (for example the 1880 – 2005 period above) becomes more and more pronounced every time they release a new version. Over and over and over…and they do the same thing with sea levels. That’s a pattern, and an unlikely one if due to a series of honest mistakes. We even have emails saying things like “It would be good to remove at least part of the 1940s blip, but we are still left with “why the blip”” and “we have to get rid of the medieval warm period”.
Consider the urban heat island effect. Anyone with a simple thermometer can measure an effect of several degrees or more — and yet the official adjustment is only fractions of a degree. (And no, using anomalies does not do away with the effect unless we have sites that are in stable city environments, not in growing cities.) Consider also the major yawn of a response when an on-the-ground survey of US sites showed an overwhelming majority of poorly located, mostly to warm thermometers.
I could go on — but I suspect that neither of us is going to budge much. I see failure of science and you do not. I see likely fraud and you see simple adjustments. I do not understand how simple adjustments can be so complicated that the scientists involved are either unable or unwilling to explain how and why they are done.
But again, thanks for your thoughts and polite tone. It counts for a lot.
Hey Jason! I also looked into String Theory, and discovered a new religion. The best explanation I have seen is this…
https://www.youtube.com/watch?v=5aLPvDUbKFE&feature=youtu.be
LOL! Gator, I fear you are making me more cynical! Keep it up… 🙂
“You have to prove that NASA put its thumb on the scale.”
Wrong.
It is NASA who have to prove they have not put their thumb on the scale.
Foe some reason, they seem reluctant to do so.
Now, why would that be, I wonder?
I have provided massive amounts of evidence in thousands of blog posts.
I have read several of your blog posts, but I have never seen any evidence of fraud, nor even any evidence of incorrect adjustments. In each of your blog posts that I read, you only showed that the data had been adjusted, as you have shown in this blog post, and then you infer, imply, or whatever-you-want-to-call-it, that the adjustments are incorrect, or worse, fraudulent. Fraud requires intent, so what is the evidence that this adjustment is incorrect?
https://stevengoddard.wordpress.com/2015/10/30/glaciers-prove-nasa-temperature-fraud/
Steven, in that blog post, you appear to be claiming that the global average temperature can’t show 1911 to be the coldest year because somewhere in the world glaciers were melting. That doesn’t make sense. Global Average Temperature refers to the average temperature for the whole planet, not to the temperature at any location. During the coldest year on record, there can be glaciers melting somewhere, and during the hottest year on record (this year), there are a few glaciers that are growing.
Your analysis is pathetic.
Well, I had to bite my tongue when I saw yours, but maybe I was wrong. You have my understanding of your analysis. Where was I wrong?
Until they come clean and provide in detail their methods and discussions that led to the rational for “adjusting” the temperature records and the specific reason for each adjustment it is quite appropriate to assume there is wrongdoing. The American people pay for their “work” and yet we’re denied the information required to assess it’s validity. That is what I would call probable cause for concluding there is malfeasance based solely on the available evidence since there is no possible argument for such information having anything to do with National Security. It is not our responsibility to prove their wrong doing, it is they that are supposed to answer to American public and justify what they are doing and why they are doing it. They aren’t doing that and that is all one needs to know to conclude they are hiding something.
That information is publicly available, rah.
Your ignolrance is showing again!
The federal government’s chief climate research agency is refusing to give House Republicans the detailed information they want on a controversial study on climate change.
http://us4.campaign-archive1.com/?u=c920274f2a364603849bbb505&id=12a5019e1a&e=f4e33fdd1e
You are talking about emails, gator, not the data and not the explanation of the adjustment. Everything required to test the data and the adjustment to the data is publicly available. In particular, Steven Goddard is claiming the explanation for the adjustment and the actual adjustment are wrong. These stand or fall on their own. No emails are required. So, what is the evidence that the adjustment is wrong?
So why are they refusing research documents? What are they hiding? If they are truly trying to save the planet, there should be no issue with releasing all of the reserarch documentation.
Simple logic.
I don’t think they are, gator, but that’s about NOAA, and this blog post is about alleged fraud by NASA. Let’s resolve Steven Goddard’s claim of fraud before we move on to your claim of fraud.
NOAA and NASA are working together, as they always have.
https://www.nasa.gov/press/2015/january/nasa-determines-2014-warmest-year-in-modern-record
What I am pointing out is that government money corrupts, absolutely. The fact that you choose not to get this speaks volumes.
You’re not pointing to anything, gator. If you have evidence of corruption in the data adjustment process, post your evidence.
We have produced evidence, and you just deny it.
No you haven’t. Steven posted a blog alleging that the global average temperature graph is wrong because there were melting glaciers somewhere in the world during a cold year. That argument is not valid. I explained why.
More denial of evidence of fraud.
No it isn’t.
http://wattsupwiththat.com/2015/10/28/ncdcnceis-karl-and-peterson-refuse-congressional-subpoena-on-flawed-pausebuster-paper/
https://notalotofpeopleknowthat.wordpress.com/2015/09/17/noaa-refuse-to-publish-methodology-for-temperature-adjustments/
I could post links to about 50 such articles.
rah, you aren’t referring to the data, the explanation for the adjustment to the data, and the adjustment to the data. That’s all you need to test the result, and it’s available. The emails NOAA has refused to supply have nothing to do with the problem you raised, so don’t change the subject.
Yes I am referring to the data and if you had even bothered to click the second link provided you would have seen that. Tell you what. Provide the web page, PDF file, or what ever that supplies the formula used to adjust the surface temperature data and fill in the blanks for the areas where they have no data and which describes the rational behind it’s application and you’ll have made your point. If you can’t then quit making false claims that it’s out there and available.
I don’t have to do that, rah. It’s your task, since you are claiming it’s wrong. The point here is that all of you have claimed the adjustment is wrong, but none of you has provided evidence to support the claim.
I think I will withdraw. I have made my point, and no one has addressed it, except Jason, but his his argument isn’t compelling, IMO. You certainly can’t claim this adjustment is wrong because glaciers were melting in the year with the coldest global average temperature.
“I don’t have to do that, rah. It’s your task, since you are claiming it’s wrong. The point here is that all of you have claimed the adjustment is wrong, but none of you has provided evidence to support the claim.”
No. You have the scientific process exactly backward. The burden of proof is not on the status quo, it’s on the changes. Until any change is explicitly proven, openly and publicly, it’s mere assertion. That the current research is based on a mountain of assertions doesn’t alter that burden of proof. It’s still on the hypothesizer to prove his hypothesis. Or, more correctly, the hypothesizer has the burden of trying to DISPROVE his own hypothesis. Frankly, that’s what all of us here would like to see more of.
Take the satellite data, for instance. It plainly disagrees with the ground data. It’s not just a step change, but a continuing divergence. At least one of those data sets, and the methodology used to obtain it, MUST be wrong. There is no other alternative. It’s absurd to believe both, as the trends are in opposite directions. This is a clear case where at least one scientist needs to re-check his assumptions, and announce to the world that his work is wrong. Yet we don’t see that. We see both data sets continuing along, in direct opposition, as though it were perfectly normal to have the world both warming and cooling at the same time. It doesn’t matter if 97% of scientists believe the ground data over the satellite data, unless those scientists can make a convincing argument as to why. (In fairness, the opposite would also be true. But I’m not aware of anyone making that claim, so it’s moot) Can you point me to any of those arguments supporting the ground data over the satellite data? Or the reverse?
“That information is publicly available, rah.”
No it isn’t.
Stop making stuff up.
Wrong. NASA only explains minute adjustments like TOB, not the massive adjustments. Also there UHI adjustments are well disputed in peer review.
Martin has about two hundred hours of research to do to catch up, but he makes assertion anyway.
And you are claiming the NASA adjustment is wrong because NOAA has refused to comply with a congressional subpoena. That doesn’t follow either.
Considering that everything they (NOAA) do is paid for with taxpayer money, there is no reason they shouldn’t comply. We are not talking national security and CIA or NSA here. Claims of preserving integrity of scientific process ring rather hollow. Since when does hiding things preserve integrity, unless there is something to hide? The taxpayers have paid for anything NOAA has done. There is no valid reason to deny subpoenas.
Wrong again.
Ever hear the statement “if you’ve nothing to hide, you’ve nothing to fear”?
What are NASA afraid of, do you think?
Or, come to that, what are you afraid of? Thou dost protest too much, methinks…
Here for the lazy, no research, mind numbed who Gruber quoted as because the American people are too stupid to understand
Adjustments also include wrong way values
From the Climategate emails # – 2328
date: Wed, 3 Jun 2009 15:07:25 +010 ???
from: “Parker, David”
subject: RE: Tom’s thoughts on urban errors …
Everybody wants to add an estimate of what UHI bias might be into their error bars, but it seems to me that rather than trust folk lore that there is a uhi bias, they first need to find one systematically in the network. Until they do that, the former is just hand waving to appease the know-littles. Jim Hansen adjusts his urban stations (based on night-lights) to nearby rural stations, but if I recall correctly (I’ll send that paper shortly), he warms the trend in 42 percent of the urban stations indicating that nearly half have an urban cold bias. Yet error analyzers want to add a one sided extra error bar for uhi…..
Regards,
Tom
http://www.ecowho.com/foia.php?file=1057.txt&search=Hansen+adjust
Bold in the original.
What they say. “Zeke” is a Serial Adjuster
Climate Etc. – Understanding adjustments to temperature data by Zeke Hausfather All of these changes introduce (non-random) systemic biases into the network. For example, MMTS sensors tend to read maximum daily temperatures about 0.5 C colder than LiG thermometers at the same location.
http://judithcurry.com/2014/07/07/understanding-adjustments-to-temperature-data/
What He measured
Interviewed was meteorologist Klaus Hager. He was active in meteorology for 44 years and now has been a lecturer at the University of Augsburg almost 10 years. He is considered an expert in weather instrumentation and measurement. One reason for the perceived warming, Hager says, is traced back to a change in measurement instrumentation. He says glass thermometers were was replaced by much more sensitive electronic instruments in 1995. Hager tells the SZ ” For eight years I conducted parallel measurements at Lechfeld. The result was that compared to the glass thermometers, the electronic thermometers showed on average a temperature that was 0.9°C warmer. Thus we are comparing – even though we are measuring the temperature here – apples and oranges. No one is told that.” Hager confirms to the AZ that the higher temperatures are indeed an artifact of the new instruments.
http://notrickszone.com/2015/01/12/university-of-augsburg-44-year-veteran-meteorologist-calls-climate-protection-ridiculous-a-deception/
Another Zeke ‘oldy but goody
http://wattsupwiththat.com/2015/03/06/can-adjustments-right-a-wrong/
After reading Zeke’s blog post, I could find nowhere the affect made to the monthly data you are posting here. Zeke ‘says’
At first glance, it would seem that the time of observation wouldn’t matter at all. After all, the instrument is recording the minimum and maximum temperatures for a 24-hour period no matter what time of day you reset it. The reason that it matters, however, is that depending on the time of observation you will end up occasionally double counting either high or low days more than you should. For example, say that today is unusually warm, and that the temperature drops, say, 10 degrees F tomorrow. If you observe the temperature at 5 PM and reset the instrument, the temperature at 5:01 PM might be higher than any readings during the next day, but would still end up being counted as the high of the next day. Similarly, if you observe the temperature in the early morning, you end up occasionally double counting low temperatures. If you keep the time of observation constant over time, this won’t make any different to the long-term station trends. If you change the observations times from afternoons to mornings, as occurred in the U.S., you change from occasionally double counting highs to occasionally double counting lows, resulting in a measurable bias.
To show the effect of time of observation on the resulting temperature, I analyzed all the hourly temperatures between 2004 and 2014 in the newly created and pristinely sited U.S. Climate Reference Network (CRN). I looked at all possible different 24 hour periods (midnight to midnight, 1 AM to 1 AM, etc.), and calculated the maximum, minimum, and mean temperatures for all of the 24 hours periods in the CRN data. The results are shown in Figure 4, and are nearly identical to Figure 3 published in Vose et al 2003 (which was used a similar approach on a different hourly dataset).If you keep the time of observation constant over time, this won’t make any different to the long-term station trends. If you change the observations times from afternoons to mornings, as occurred in the U.S., you change from occasionally double counting highs to occasionally double counting lows, resulting in a measurable bias..
If the TOA does not trend in the monthly average, then a single change in time of observation would not change more than the month in which the time change was made in. His study only looked at the daily temperature changes based on TOA. He never shows how much it would change the monthly average, most likely because it doesn’t.
Or just put in any number you like.
Monthly temperatures which are marked with an “E” are “estimated” rather than measured. More than half of the current data for 2015 is fake.
https://stevengoddard.files.wordpress.com/2015/02/screenhunter_7444-feb-26-07-59.gif?w=640
https://stevengoddard.wordpress.com/2015/02/26/ncdc-hits-new-milestones-of-fake-data/
And of course forget your own reporting.
August 2015 – The combined average temperature over global land and ocean surfaces for August 2015 was 0.88°C (1.58°F) above the 20th century average of 15.6°C (60.1°F) => 0.88°C (1.58°F) + 15.6°C (60.1°F) = 16.48°C (61.68°F)
http://www.ncdc.noaa.gov/sotc/global/201508
July 2015 – The combined average temperature over global land and ocean surfaces for July 2015 was the highest for July in the 136-year period of record, at 0.81°C (1.46°F) above the 20th century average of 15.8°C (60.4°F), surpassing the previous record set in 1998 by 0.08°C (0.14°F).
=> 0.81°C + 15.8°C = 16.61°C or 1.46°F + 60.4°F = 61.86°F
http://www.ncdc.noaa.gov/sotc/global/201507
May 2015 – The combined average temperature over global land and ocean surfaces for May 2015 was the highest for May in the 136-year period of record, at 0.87°C (1.57°F) above the 20th century average of 14.8°C (58.6°F),
=> 0.87°C + 14.8°C = 15.67°C or 1.57°F + 58.6°F = 60.17°F
(1) The Climate of 1997 – Annual Global Temperature Index “The global average temperature of 62.45 degrees Fahrenheit for 1997” = 16.92°C.
http://www.ncdc.noaa.gov/sotc/global/1997/13
(2) 2014 annual global land and ocean surfaces temperature “The annually-averaged temperature was 0.69°C (1.24°F) above the 20th century average of 13.9°C (57.0°F)
= 0.69°C above 13.9°C => 0.69°C + 13.9°C = 14.59°C
http://www.ncdc.noaa.gov/sotc/global/2014/13
16.48°C >> 16.61 >> 15.67 >> 16.92 << 14.59
They cannot even keep the same 20th century average of 15.6°C or 15.8°C or 14.8°C or 13.9°C the same 15 years after it was over?
Since 1997 was not even the peak year, which number do you think NCDC/NOAA thinks is the record high. Failure at 3rd grade math or failure to scrub all the past. (See the ‘Ministry of Truth’ 1984).
What would it have been if they were still using the semi-adjusted HADCRUT3 version instead of the full-adjusted HADCRUT4.
12 month average anomaly
HADCRUT3 HADCRUT4
Dec 1998 0.55 0.52
Dec 2011 0.34 0.40
Increase/ -0.21 -0.12
The new version increases warming (or rather decreases cooling) since 1998 by 0.09C, a significant amount for a 13 year time span. Whilst the changes should not affect the trend in future years, they will affect the debate as to whether temperatures have increased in the last decade or so.
https://notalotofpeopleknowthat.wordpress.com/2012/10/10/hadcrut4-v-hadcrut3/Decrease
Martin Smith says:
October 30, 2015 at 3:15 pm
I don’t have to do that, rah. It’s your task, since you are claiming it’s wrong. The point here is that all of you have claimed the adjustment is wrong, but none of you has provided evidence to support the claim.
——————————————————————————
It is impossible for me to produce something that doesn’t EXIST and the fact you claim I can is beyond silly. Yes I would say it is best for you to “withdraw” since you can’t produce what your whole argument is based on.
Martin – The problem that is abundantly evident in the constantly changing temp anomaly is the instrumentation from the at least the last five years is unchanging. UHI aside it make absolutely no sense to adjust temperatures from instrumentation that is unchanging unless there is a documented testable and verifiable drift in the instrumentation results. By changing the results year on year, you are in effect saying that the instrumentation is incapable of recording data with sufficient accuracy and precision to be of use in determining a global temperature trend/anomaly. You don’t adjust the underlying data, however you must adjust the error bars to account for this apparent ongoing data drift (all up oddly). The error bars applied to NOAA’s constantly changing temp anomaly theoretically should be increasing with each adjustment. I don’t see that.
Steven, I think it would be more effective if the yellow rectangle stayed the same size as the data sets cycle through the animation, so that the viewer can directly see the changes instead of having to rely on visual memory.
Martin Smith,
As I’ve read through your demands and protestations above, one question kept coming up:
Do you know how disingenuous you sound?
Part of me thinks you must know that but I’ve also met plenty of people who appeared completely unaware or in denial about how they came across. For the most part I found it’s impossible to determine with any certainty who is who since both the suspected conscious and unconscious types exhibit similar traits in their argumentation.
Tony-
One suggestion I’d make is to leave the X and Y values the same, between the graphs. If you’re comparing the 1880-2005 values, chop off the later data from the newer graphs, and extend the Y axis in the older ones to accommodate the newer data. Keeping all the annotations the same would help, too. Anything changing other than the temperature plot is distracting, especially to people not familiar with reading graphs. I understand that you’re literally putting the published NASA graphs on top of each other, and I think it makes an effective point. But it also leaves them harder to compare than cleanly redrawn graphs would.
Alternately, instead of truncating the newer data, you could highlight the end point of the older data in some way, to show where your comparison stops. Perhaps the yellow section in your above graphic could stop at 2005. I think that would make the difference more clear than the circles you’re using now. Or maybe draw a vertical line at each year you want to highlight, with horizontal lines at the points where the earliest graph intersects those years.
Just my 2 cents. After taxes, it’s probably worth less than nothing.
Hey Ted! All good ideas — but I bet you a doughnut that the more Tony changes the graphs, the more warmists will say “that’s not the real graph! He changed it from what NASA showed!”
Danged if you do and danged if you don’t. 🙂
Reblogged this on Climate Collections.