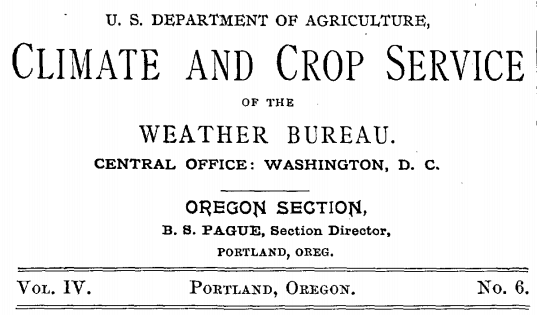
Mark Albright has located a smoking gun of NCDC data tampering in Oregon.
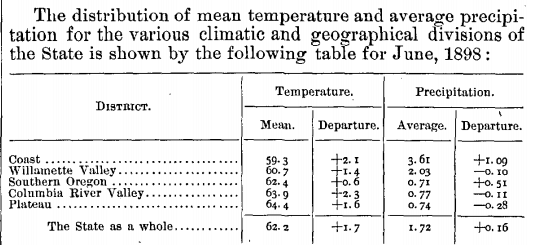
In June, 1898 the US Weather Bureau reported that Oregon averaged 62.2F for the month, 1.7 degrees above normal. But NCDC reports that June, 1898 in Oregon was 56.4 degrees, 0.8 degrees below normal.
The US Weather Bureau normal in 1898 was 60.5F, and in 2014 the NCDC normal is 57.2F. In other words, Oregon was much hotter in the 19th century than it is now, and the NCDC US temperature record is meaningless political propaganda.


But Steve, we all know that they didn’t know how to read thermometers back then.
I’m sure the scandalous rats in Washington are busy erasing the server this report is located on. BTW, if anyone can find the GISS global V.1 dataset, let us know!!
Especially now that the Virgina Supreme Court just gave UV the go ahead on erasing Mikey Mann’s emails and any other damning evidence.
Isn’t it nice to know the ‘Rule of Law” is alive and well and protecting US citizens from criminals… like those in our government and universities. (Snarl)
It looks like they just averaged the 5 temperatures in 1898, rather than weighting them according to land area, and what about the colder Cascade mountain range, which wasn’t measured?
These seem like reasonable points. Anybody have a response?
Old Jedi mind trick. The average of all Oregon HCN stations that month was also 62 degrees.
Calling Winston Smith!! The Ministry of Truth has more history to be modified!! You missed some!!
To quote the warmist’s, why do you want access to my data, you just want to prove me wrong!
I have today learned 2 degrees of the nearly 6 degrees of temperature adjustment in June 1898 can be accounted for by a change in the method of calculating the state mean temperature which was implemented in Feb 2014. The new method tries to account for under sampled and cooler high elevation locations across the state. This method corrects for the tendency to locate observing sites at relatively low elevations across the state. So now with this correction, the state mean temperature is now partially decoupled from the direct observations. This cooling correction applies to all years of record, although slightly more to the early years of record around 1900 than to recent years. This comparison tool may shed light on the process of correcting the state temperature for the elevation sampling bias:
http://www.ncdc.noaa.gov/temp-and-precip/divisional-comparison/
“Calvinball is a game invented by Calvin in which one makes the rules up as one goes along. Rules cannot be used twice. No Calvinball game is like another. The game may involve wickets, mallets, volleyballs, and additional equipment as well as masks.”
http://calvinandhobbes.wikia.com/wiki/Calvinball
Could you explain where one can get the dataset (or report or graph or whatever) in which NCDC says June 1898 in Oregon was 56.4 degrees? Thank you.
I think taking newspaper data like this would be a great way to show how flawed NCDC data is. Crowd source as many articles / sources as possible. If you get, say, 1000 data points, then take every one of them and compare historic paper record with the same result from the “value added” (cough) data. I think you would be able to show that the current representation of the past is rejected at near 100% confidence across cities, states, regions, and time. Might be fun.