
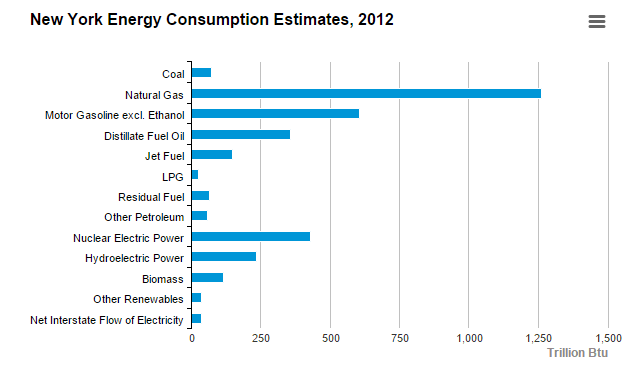
New York burns approximately 3,000,000,000,000,000 BTU’s of fuel every year, which averages out to about 100 billion watts over the course of the year.
Climate experts tell us that this increase of 100 billion watts of heat energy since the 19th century, has essentially no impact on the surface temperature readings. Real geniuses they are.

And let’s not forget the other localized island effects that also exhibit some spectacular energetic properties:
Magnitude 7.1
Northern Mid-Atlantic Ridge
2015-02-13 09:59:12 UTC-09:00
It never hurts to sign up for notifications:
https://sslearthquake.usgs.gov/ens/
If this is not UHI, it must be Kevin’s missing heat :
https://docs.google.com/file/d/0B2qKORan7fzBOU1xSzFTS1RiZEU/edit?usp=drivesdk
100e9 watts / 141,300,000,000 m^2 = 0.708 W/m^2. Canonical (and I mean that) forcing for a CO2 doubling is 3.7 W/m^2, which equates to about 1.2°C. So, if you believe that much (which is considered direct, no-feedback warming, and is questionable on many levels), you’re looking at 0.7/3.7*1.2=0.23°C warming from that source, as an average, state-wide. It’s not a major impact when you smear it state-wide, but would be a large contributor considering that the localized usage of that power is very concentrated to urban areas. Typical “urban” concentrations are around 3% of land area, as I recall… So is 0.23°C / 0.03 urban = 7.6°C the correct calculation as peak UHI? No. But it gives you an idea of the scale of the issue.
NY city covers 1.2exp9m2 so if that was just for the city, multiply by 10 (90% goes into the oceans).
I think he means state. A different estimate I found put it at 4e15 BTU/yr, Steve is quoting 3e15, pretty close.
Taking Steve’s example a bit further and going world-wide, energy use is about 550 exajoules per year, which is 1.74e13 watts. Earth’s area is 5.1e8 sq km, or 5.1e14 m^2. This is 0.034 W/m^2, which is safe to ignore. Urban area is 3.5e6 km^2 or 3.5e12 m^2 (estimate by GRUMP), and this is about 50% of the population. So urban w/m^2 is 1.74e13 * 0.5 / 3.5e12 = 2.48 W/m^2, which would equate to 2.48/3.7*1.2 = 0.8°C, just about the measured increase. The other figure you can back into is that urban land accounts for 3.5e12 / 5.14e14 or 0.68% of the surface, or 3.5e12 / 149e12 = 2.35% of the land area.
Since the subject has been started there’s something that I have thought about…
Supposedly the hydrocarbons we use are stored solar energy, according to our dear ‘experts’. Now this stored solar energy is extracted and it all pretty much ends up as heat in the atmosphere. The experts tells us we are consuming however thousands or millions of years of this stored energy from the sun at a very rapid pace. Yet these same experts consider the heat released from this activity to be negligible but the CO2 is the problem. Now if it’s a negligible amount of energy then nature should be able to quickly take up the CO2 and get it into some sort of life form that will eventually become a hydrocarbon again. If nature can’t do that, then it’s probably not a negligible amount of energy or it isn’t stored solar energy or both. Another option is that heat quickly goes out into space in which case their greenhouse theory isn’t really working because that says it is trapped near the surface.
Of course when I pose difficulties like this I am usually told I am ‘stupid’ but there is never really an answer that fits everything experts tell me all at the same time.
What amazes me is no one has correlated the NRCS (SCS) land surveys and the temperature readings at different weather stations. Using arcgis they should be able to tell which stations are most impacted by UHI by simply comparing the surrounding stations to the rural stations using buffers. It is not perfect but it might give a much greater idea of UHI if all the surrounding rural stations show several degrees cooler than the urban station for the same time period. Should be fairly easy to do though time intensive.
What I do find most interesting is the people most concerned about global warming are those who live in the UHI, but if you talk to farmers and ranchers they don’t care as infrequent floods and droughts are their biggest enemies. And even then most would welcome a wetter world than a drier one.
Hello Ronald,
I did this (as best I could) for the temperature station in Melbourne that Tony has frequently used as an example of UHI. I posted my findings below as “Tom”.
https://www.youtube.com/watch?v=F_G_-SdAN04#t=22
My area in central Indiana is running more than an inch below normal despite some pretty good snows. I’m actually beginning to hope we get a another good winter blast for the sake of the farmers. They need then deep penetrating moisture than comes from the melt.
PDO/AMO drought correlation:
http://sparkleberrysprings.com/v-web/b2/images/climate07/04mcabefig4lg.png
Yes but when you take into account the theory of back radiation it will increase temperatures a lot more. In a city environment there is less sky and more reflecteted radiation off the buildings etc. so the heat will hang around a lot longer.
Hello Tony,
I have been researching the temperature anomaly (step function increase) that abruptly occurs at the Melbourne Regional office (site 086071) in 1960 and beyond. UHI in general is a serious issue, but at this site direct reflection from massive window and concrete high rises explains what happened to the temperature record from 1960-onwards.
Multiple aerial photographs by Jim Payens in 1958-1960 of the area immediately South of the Royal Exhibition House (built 1880) and this temperature station show short concrete structures to the south and west. Prior to 1958, all buildings in Melbourne were height restricted at 11 to 12 stories. In 1958, the all glass-face 20 story ICI house (now Orica house) was built 500 feet away to the East-South-East of this temperature station – the reflection from this structure would illuminate the temperature station in the afternoon and evening. The ICI house was one of 22 major new multi-storey office buildings that were built in Melbourne in the second half of the 1950s. This coincides with the temperature anomaly that began at this station in 1960.
Please go to Google Map and start a street view at the 33 La Trobe Street apartment building. This building 50-60 feet due south of the temperature station. As you gaze up at the concrete and glass facade, notice that many windows have a reflective curtains obviously there to reflect the direct sunlight into the owner’s apartment. I am not sure when this building was built but it is not there in the aerial photo record of Payens. My guess is in the 1960-1970’s given its style. The sun’s reflection onto the temperature station from this building would be intense during the day and particularly during the spring, summer and fall months.
Other massive glass and steel high rises south of the temperature station are clearly visible as you Google-street stroll west along La Trobe Street. When you get to Exhibition Street, turn right and take a look at the 12 story glass and steel “Mantra on the Park” Hotel (constructed 1990) at 333 Exhibition Street. This building is 250 feet West-South-West of the temperature station and its oblique angle makes it almost perpendicular to the temperature station. The reflection on the temperature station would be intense in the morning hours.
I believe that direct reflective energy specifically and UHI in general account for the sharp temperature rise anomaly in 1960 and onwrds. Any data from this temperature station after 1958 should not be used for any purpose that I can think of.
I am not an expert, but I do have source documents, photo’s and other information that I am willing to send you if you think it is important.
Sincerely
Tom
Urban or Rural station ?
http://www.martingrund.de/pinguine/pinguincam1.htm#2
http://www.summitcamp.org/status/webcam/
http://seaice.alaska.edu/gi/observatories/barrow_webcam
Manhattan, where I worked in the past, went from a few dozen sky scrappers to hundreds and hundreds of these. I can’t imagine how hot it is now on the streets there! It was hot enough back in 1978 except for the WTC which worked like this immense wind tunnel so in winter it was very brutal in the plaza there and in summer you could be knocked off your feet sometimes.
Personal experience working in the river channel between the two levees in dallas and then going 1000 feet onto asphalt gave about a 7F increase in temperature (98 vs 106). They seem to ignore the evaporative effect of vegetation in cooling. My recommendation for any of these so called scientiests who dismiss UHI as being minimal is to walk on side walks barefoot and then on grass. Tell me the change is only fractions of a degree and then compare urban surface area vs. vegetative area.
No doubt about it. Climate alarmist are gagging at a grain of sand (carbon dioxide emitted by fossil fuel burns) and swallowing an entire mountain (heat energy emitted by fossil fuel burns, and by “renewable green energy” burns, and by multiple energy exchanges such as air conditioning).
The Warming in Alaska:
Remember Verity Jones showed the northern stations have been removed from the list of reporting stations: