
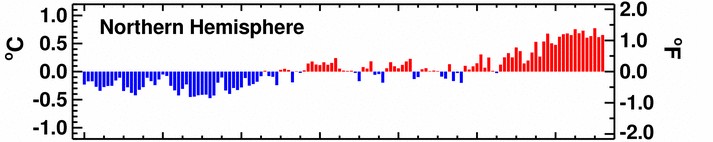
This is the current NOAA Northern Hemisphere graph
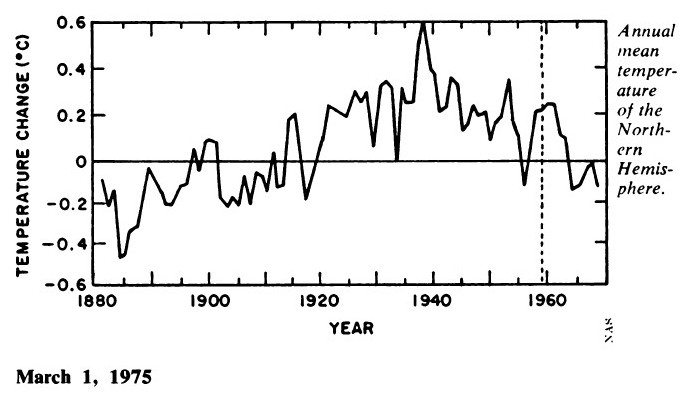
This was the 1975 National Academy of Sciences Northern Hemisphere graph
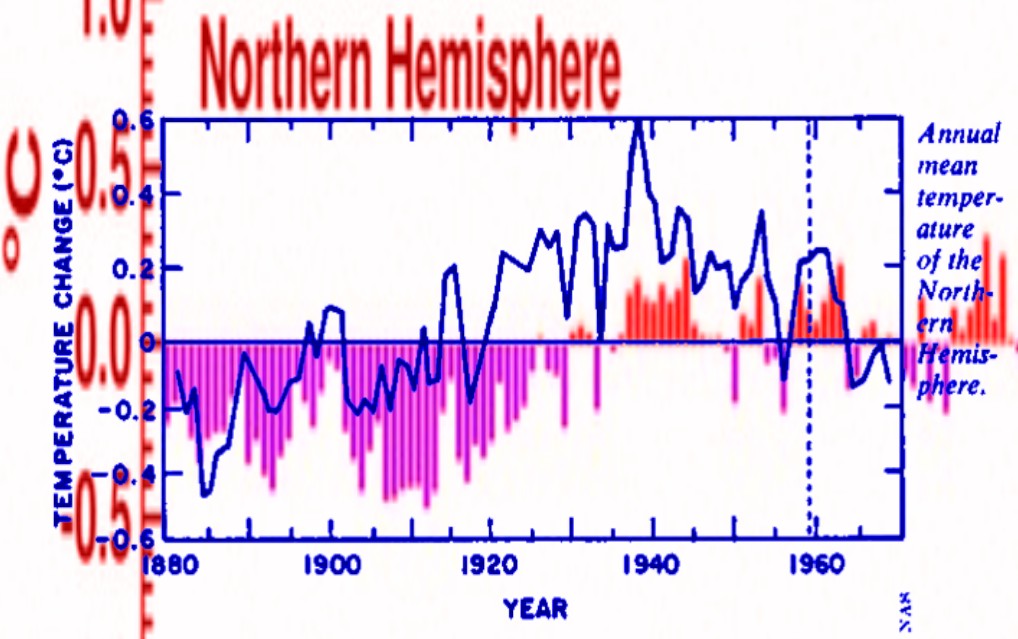
The next graph shows them overlaid on top of each other. They have erased the warmth from 1890 to 1960, and in particular the hot 1930?s
Like GISS and CRU, the NOAA temperature record is a complete fraud.

Sew them.
Great find, Steve!
It appears that, compared to the 1975 graph, their adjustments have subtracted about 0.5 °C from the temperatures from about 1911 to about 1938 (and smaller amounts after that until about 1960), and they’ve added about 0.15 °C to the early 1970s. That’s a total of about 0.65 °C of warming added for the entire northern hemisphere, which is very similar to the 0.7 °C in adjustments that NCDC & NASA GISS have made that added warming to the U.S. 48-State temperature record.
It’s also about the same as the total amount of warming that the entire planet is said to have experienced during the 20th century.
Where did you find that 1975 National Academy of Sciences Northern Hemisphere graph?
Just a question: How were the NAS measurements obtained? How does this method differ from NOAA’s? Satellite records vs. actual ground temperatures? Or what?
Both were from the same set of surface data.
http://web.archive.org/web/20090224123322/http://www.sciencenews.org/view/download/id/37739/name/CHILLING_POSSIBILITIES
Where’s the year scale on the 1975 graph?
I meant the current scale not the old one.
For information on the Sun’s influence on Earth’s climate, see:
http://scienceandpublicpolicy.org/images/stories/papers/originals/grand_minimum.pdf
Actually, if you look closely, that “1975” graph ends in 1968. The magazine was published in March, 1975, but it used an older graph.