
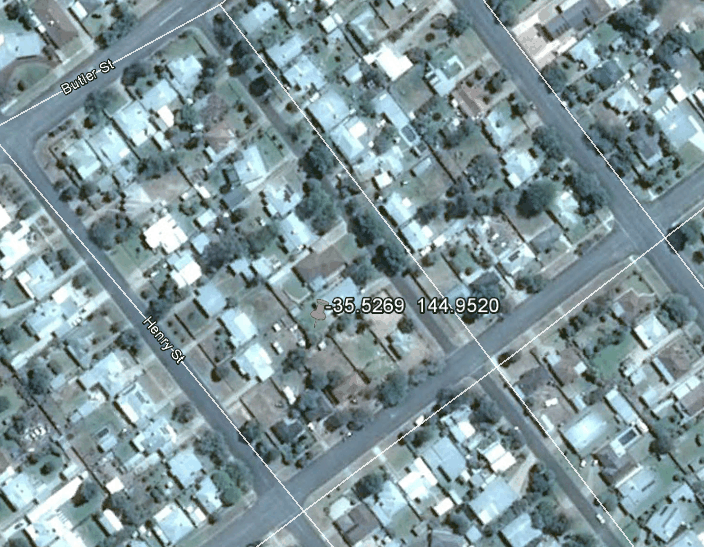
Deniliquin is a small town located 270 km north of Melbourne and 370 km west of Canberra. It is one of the oldest stations in Australia and operated through 2003. The station showed a general cooling trend since the 1890s
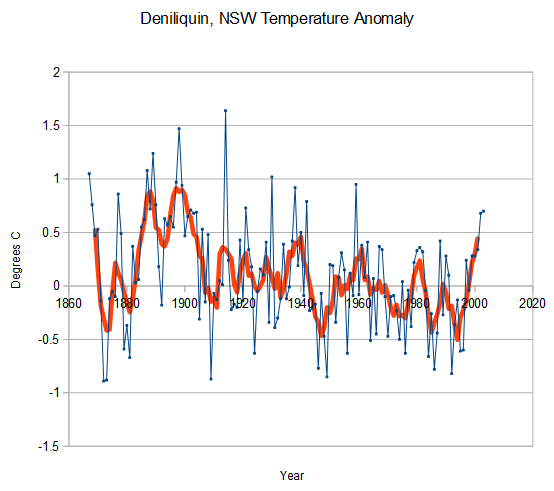
Gavin made the cooling disappear a few years ago, and turned cooling into warming.
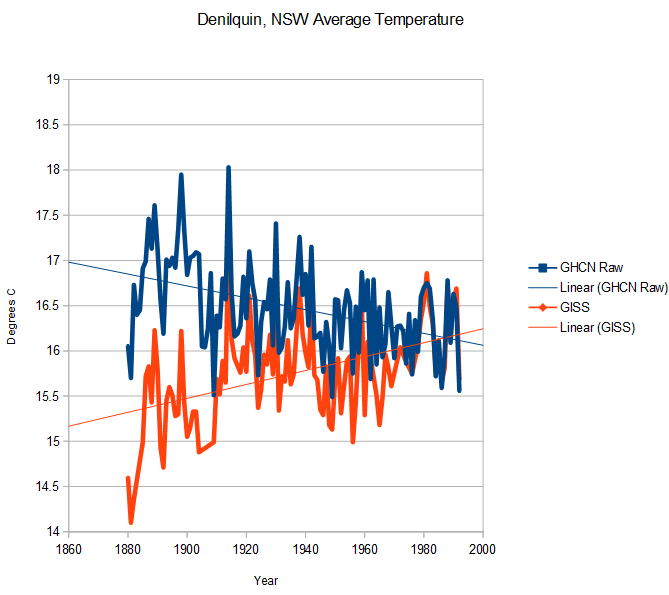
In order to hide the hot past, he knocked almost 2.5 degrees off of older temperatures.
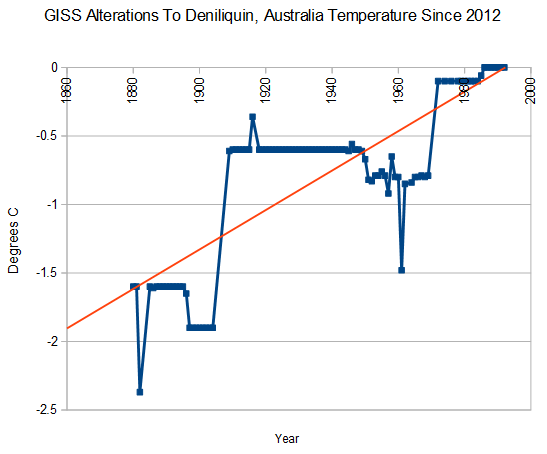
This turned a sharp cooling trend into a strong warming trend.
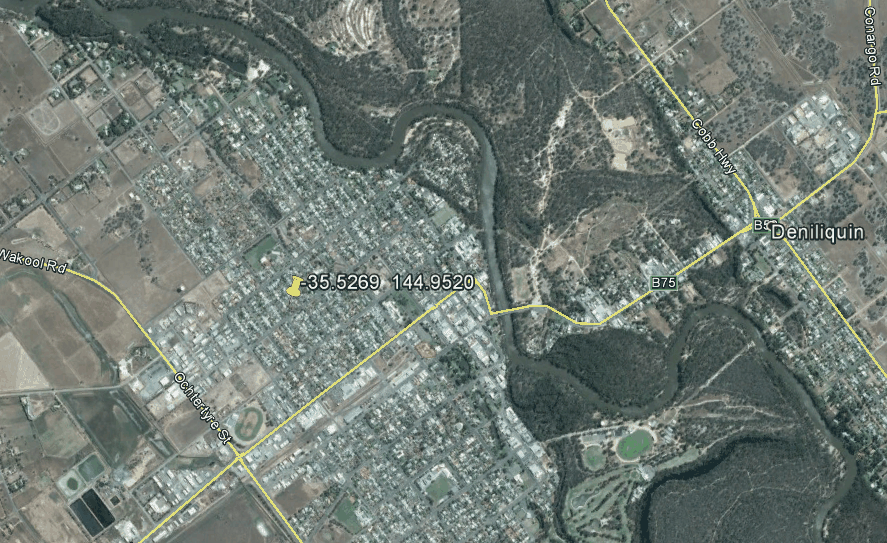
Satellite photography shows that Deniliquin is fairly rural, but the station is in the middle of a neighborhood and was undoubtedly affected by the paving of the roads and growth of the town.

The more these AGW promoters talk, the more obvious it is becoming that battle lines are being drawn between
1. Joseph Stalin’s little helpers that adjust data to fit the UN’s Agenda 21 of worldwide totalitarian communism
2. Truth of the benevolent reality that makes, sustains and destroys every atom, life and world.
Camp #1 has all political power.
Camp #2 cannot be defeated.
Reblogged this on Climatism and commented:
My historical and existing family grew up around Deniliquin. To have their temperature record trashed by global warming zealots abroad, in order to push their religious ideology/scam, is an unmitigated disgrace and yet another wicked blow to science and discovery.
Shame on you Gavin Schmidt, NASA, NOAA, USHCN et al.
Really.
They can tamper with the Data but the situation on the ground challenges it . The Winters here in Australia, particularly in the southern areas of NSW have become colder & they last much longer.
Towns like Deniliquin that would rarely have seen Snow two decades ago,,, now commonly see it these days, even into the Spring season; not just the ranges but down into the river country. It is a fact that there’s been more Snow in Australia in recent years; yet NASA & IPCC avoid this reality!!
http://www.wtvy.com/home/headlines/Rare-Spring-Snow-Falls-in-Parts-of-Australia-279241052.html
Mate you’re on drugs there has NEVER been snow in Deniliquin
Gee, there sure are a boatload of cherries on this tree! Should be one Hell of a harvest!
Many of us have used the analogy of the emperor’s new clothes. But to my mind it’s got beyond some idiot thinking he’s walking down the street with clothes on.
Now, they know they’ve got nothing to hide their embarrassment … nothing at all except the shear brass balls to carry on and dare the idiot politicians who also know this whole thing is crap to be the first to say they too don’t think there’s any clothes.
Great! Now I have a mental image of Mann’s pasty white butt wandering down Main St.
(Tar and feathers, tar and feathers, tar and feathers… that’s better)
It could be worse
http://www.weeklystandard.com/sites/all/files/imagecache/teaser-large/images/teasers/15-25.Hayward.jpg
http://scottishsceptic.co.uk/wp-content/uploads/2015/02/Plants-love-CO2.png
http://oi61.tinypic.com/2hcgvgi.jpg
I want both on my pick-up as stickers.
Hey Gail! This is what I have on the back of my truck.
http://ideonexus.com/wp-content/uploads/2009/06/hydrocarbonpowered.bmp
I love watching hybrid drivers behind me trying to figure it out, you can usually watch their lips move under a furrowed brow. Then there is this idiot who hasn’t a clue…
I was pretty confused looking at it. The person who had purchased the vehicle was obviously the victim of a very elaborate scam, but the logistics of successfully pulling off such an obtuse hoodwinking were puzzling me. How would someone successfully convince some poor rube that they were buying an “Eco-vehicle” that runs on hydrocarbons?
Did the salesman tell the poor sap that the car could be filled up at any old regular gas station, and that the futuristic engine under the hood would, through the “power of osmosis” or some such tripe, extract the hydrocarbons from the gasoline? I could just imagine the car dealer pitching the sale to the unsuspecting lepton, “It’s fortified with science!”
“I was pretty confused looking at it.” Confusion is the normal state for such people.
I imagine they would have a real conniption if they visited the two yards where we park our trucks when it gets really cold. Imagine what they would think of over 200 big trucks idling with no one in them!
My truck, being new, has a thing called “idle management”. When it’s running I just push a button and it shuts down. The oil temperature is monitored and when it drops below 60 deg. F the truck kicks on and idles until it brings to temp up to normal operating level and the batteries are fully charged. Then is shuts down again. But most of the trucks have to just idle continuously to keep the diesel from gelling.
Try again here…
http://www.moonbattery.com/archives/hydrocarbon-powered-eco-vehicle.jpg
https://imagizer.imageshack.us/v2/339x495q90/r/690/700ppm.jpg
Here’s a nice badge
http://members.optusnet.com.au/~gradds55/itsnotwarming.jpg
Wow.. sorry SG, that came out way too big.
Downsize it if you need to !!
Where can I get one ?
Feel free to download it and use it. 🙂
Steven, have you conducted a study to test if for the USA in USHCN, GHCN and GISS they all use the same RAW data to start with?
Or do they use different starting points as well as different processing?
Sorry fellow sceptics, but after studying this (and surrounding) data for several weeks I can confirm that Deniliquin RAW Tmax is indeed a few degrees C too hot before 1908, possibly poor radiation screening in whatever they were using before a Stevenson screen was put in, which monthly data suggests was in late February 1908.
OK, but that doesn’t explain why all temperature peaks above from 1920 -1980 are now showing as less than current
Mikky, would you please post the data for your conclusion.
Mikky you could do a pair wise analysis (by day of year or week) split on the date the equipment was changed. Such an analysis might show if there was a statistically significant step up in temperature at that point in time. I presume that adjustment factors used are derived in a similar fashion, not by human judgement?
From the DENILIQUIN PASTORAL TIMES –
Businesses flooded as water pipes freeze:
A Cressy St, Deniliquin business had 1000 litres of water drop into it on Sunday, after below freezing temperatures caused water pipes to break.
…
TYLA HARRINGTON August 5, 2014 3:30am
At least four Deniliquin businesses were flooded at the weekend after below freezing temperatures caused water pipes to break.
Works manager with Deni Works Jim Grant said the -2.1°C on Saturday and -3.5°C on Sunday — the coldest August temperature on record in Deniliquin — caused the water to freeze and led to several water pipes expanding and cracking.
Mr Grant said he was aware of four businesses which had flooded, while at least five homes lost water supply because their water had frozen. – end quote –
http://www.mmg.com.au/local-news/deniliquin/businesses-flooded-as-water-pipes-freeze-1.77108
…
We should remember : Deniliquin is one of the hottest towns in the southern region of NSW.
When the Graphs & Predictions don’t match the outcomes ; the evidence reveals corruption.
The Coldest August temperature on record – “was last year” ; that is not a Warming trend…
Here is convincing (to me) evidence for Deniliquin being recorded too hot prior to 1908. It is not credible for Deniliquin to be 1C warmer than Adelaide after 1908, but not before:
http://i57.tinypic.com/4qrlt0.jpg
Many places in central Australia recorded very high temperatures around 1890-1910
Adelaide would always be moderated by its ocean proximity.
You need to try to find places that are more in the interior of Australia to make a valid comparison.
If you have access to data, look at places like Echuca, Wagga Wagga, Hay, Broken Hill, West Wyalong, Griffith, Ivanhoe, Swan Hill, Wangaratta, Shepparton, Albury, Mildura.
At least a few of these places should have pre 1910 data.
http://jonova.s3.amazonaws.com/guest/bryce-ian/echuca-solar.png
http://jonova.s3.amazonaws.com/graphs/australia/2013/no-summer-melbourne-days-1856-2013-above37c.gif
For consideration.
There is no step down there. You are seeing things you want to see.
He is ‘seeing’ the natural variation that the BEST AlGoreRhythm ‘sees’ and then uses as an excuse for modifying the data.
Notice in both cases there are no written record by the observer/data recorder to back up the guess work.
However we do have this: Instructions for Voluntary Observers, Washington DC Government Printing Office On page 22 are the instructions for the construction of a Stevenson Screen.
Another book The American Meteorological Journal, Volume 8 from 1891 also mentions the ‘regulation Stevenson screen’
The “Leste” occurs in Spain.
And finally we have this from Jo Nova.
(I did not include links)
Go to Jo Nova’s site for more investigation into the old temperature records, newspaper clippings ….
http://joannenova.com.au/tag/australian-temperatures/
AndyG55 and Steve, I have looked at all those places you mentioned, it would indeed be better to use comparison stations that are closer than Adelaide, but unfortunately they got themselves organised around 1908 and most show the same (or similar) steps down, but with enough of a time difference to “prove” that it was not climate.
Ever since 1908 Deniliquin and Adelaide have tracked each other very closely apart from a very constant 1C (on average) difference. How could things have been so different before 1908? Changes to the systems in use is by far the most plausible explanation. Making appropriate shifts restores the close tracking of the stations before 1908, and before 1897/8 when there was another set of step changes.
Adelaide and Denny are in totally different climatic zone.
If there were a consistent climate pattern of blocked wind movement over several years, like say in the Federation Drought, there is every possibility that the central parts of NSW would get a large build-up of heat.
The data (and the geography) does not support “totally different climatic zones”, in fact quite the opposite. Nearby ECHUCA should closely match Deniliquin if thermometers had been faithfully recording a build-up of heat, it doesn’t, it faithfully records a series of major system changes.
Heat build-ups don’t last 20 years, and don’t remain confined to small areas, sheesh why are some sceptics of a changing climate so keen to hang on to a massively changing climate. Correcting early data from Oz gives an unchanging climate, what is not to like about that?
You were talking Adelaide and Deniliquin.
Those were the ones I was saying were different.
If there s sufficient data from Echuca, and those other places I mentioned to discount the large bulge before 1908 at Denny, then sure, I have no problem with that.
But don’t use Adelaide.
What might be interesting would be to try to find rainfall data for Adelaide and Denny from 1890 – 1910.
Like I said, Adelaide is not perfect as a reference but it is the most suitable one, as most of the nearby stations were undergoing similar system changes. Actually there are a few nearby that appear not to have had changes around 1908 (Beulah, Wangaratta, Benalla), but they don’t have enough years before to be sure.
Those other stations are “consistent with” the essentially non-changing-average-climate recorded at not-very-distant Adelaide.
Adelaide is warming four times faster than Caliph
Adelaide is NOT at all suitable for comparison with Deniliquin.
They are nearly 600km apart !!
Adelaide is right on Gulf St Vincent. The Southern Ocean.
Denny is in the lower central west of NSW.
They are affected by very different climate patterns.
Next you will want to compare San Francisco with Las Vegas or something !!
The climate differences you mention certainly do apply to Melbourne, but if you plot Adelaide and Deniliquin on the same graph you see remarkable similarity, every peak and trough matching. Data trumps theoretical hand-waving. Are you saying that it never gets hot in Adelaide?
A longer process of correction would be to move out from Adelaide, first correcting Mildura, Broken Hill and Kerang, then using them to correct Hay and Deniliquin, but ALL of these have the same “shape”, proof that one can go directly from Adelaide.
And in Australia, climate patterns can last for several years.
From 1880 – 1903 there were two major droughts, in central NSW-Vic with a small respite between.
http://www.jaconline.com.au/downloads/sose/2004-11-drought.pdf
Long droughts lead to loss of local water and hence the loss of local cooling effect.
Adelaide would always have the local cooling effect of the ocean.
Sorry, but your comparison of Denny with Adelaide is not very persuasive at all.
A bit of research confirms that the Edwards/Murray Rivers near/through Deniliquin did run dry during the Federation drought.
The loss of these bodies of water would have cause a big loss of the cooling effect.
Here is some reading for you.
http://climatehistory.com.au/wp-content/uploads/2009/12/Garden_Book_Chapter_2010.pdf
The Federation Drought years remain in the corrected data, but only at the level of an extra 0.5C (in the averages), not at a level of 3C.
Oh and the town’s highest temperature of 49.5 °C (121 °F) was reached on 12 January 1878 and is one of the highest ever recorded in Australia.
Records is what you get from thermometers that are reporting 3C too hot.
Do you hold a special license to just make up convenient numbers for your argument?