
Since 1991, NCDC has cooled America’s temperature by almost 0.5C, yet they report temperatures within 0.01F. Junk science at its worst.
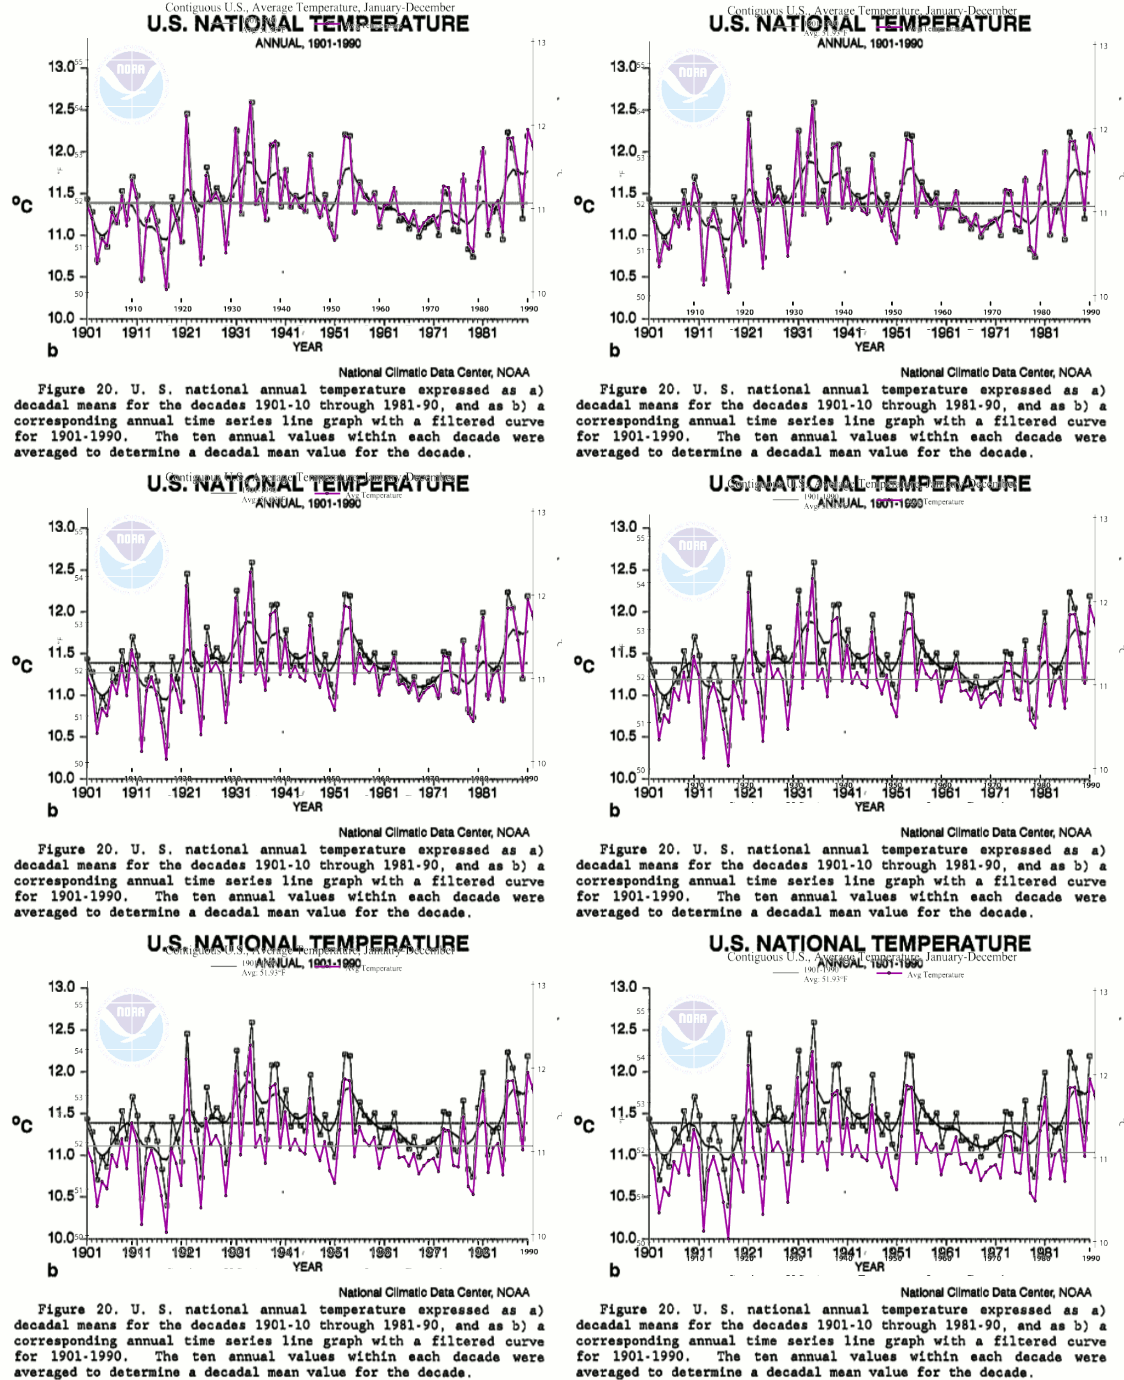
Since 1991, NCDC has cooled America’s temperature by almost 0.5C, yet they report temperatures within 0.01F. Junk science at its worst.


You would think that a science that was settled decades ago, would have settled on a data set before now.
Somebody please help me out as I am not a up on my math skills or the TOBS adjustment.
I went to the NCDC NOAA and read the article and saw the last chart which shows the difference between raw temperatures and final USHCN data. Which shows NOAA adding almost .6 of a degree since the 60’s. I would think that NOAA would be getting better at reading daily temperatures and get rid of the TOBS, but from the chart, it shows they are getting more inept at reading the raw temperature.
http://www.ncdc.noaa.gov/oa/climate/research/ushcn/ushcn.html#QUAL
Exactly! One would think that younger and younger data made with newer and newer instraments wouldn’t require any correction, but in our brave new world, that doesn’t seem to be the case.
thanks for sharing the link; i was not aware that there are actually five adjustments made to raw data
Estimates for missing data are provided using a procedure similar to that used in the homogeneity adjustment scheme in step three. This fourth adjustment uses the debiased data from the third adjustment (SHAP) and fills in missing original data when needed (i.e. calculates estimated data) based on a “network” of the best correlated nearby stations.
the fifth being the adjustment for Urban Island affect — probably also adjusted upwards because NOAA knows that cities would be so much warmer if it weren’t for the air conditioners cooling the buildings during the Summer 🙂
Worst blizzard for years, the temperature got below zero.
http://www.britishpathe.com/video/worst-blizzard-for-years/query/wildcard
And then it warmed up.
http://www.britishpathe.com/video/ware-icebergs/query/wildcard
Steve. it can’t be TOBS because according to Zeke the changes should look like this graph ie no cooling by more than 0.05C prior to 1950
https://curryja.files.wordpress.com/2015/02/figure-2.png