
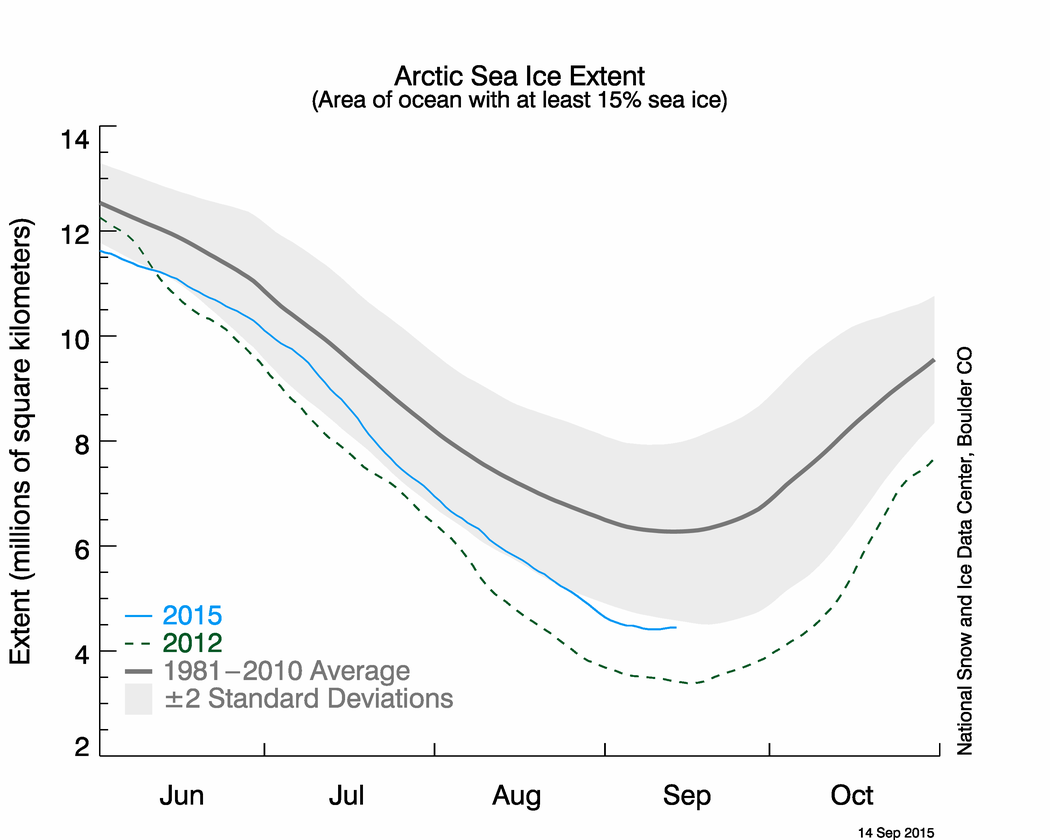
The Arctic summer minimum sea ice extent was reached very early this year, due to cold weather which set in early in August over the Beaufort Sea.
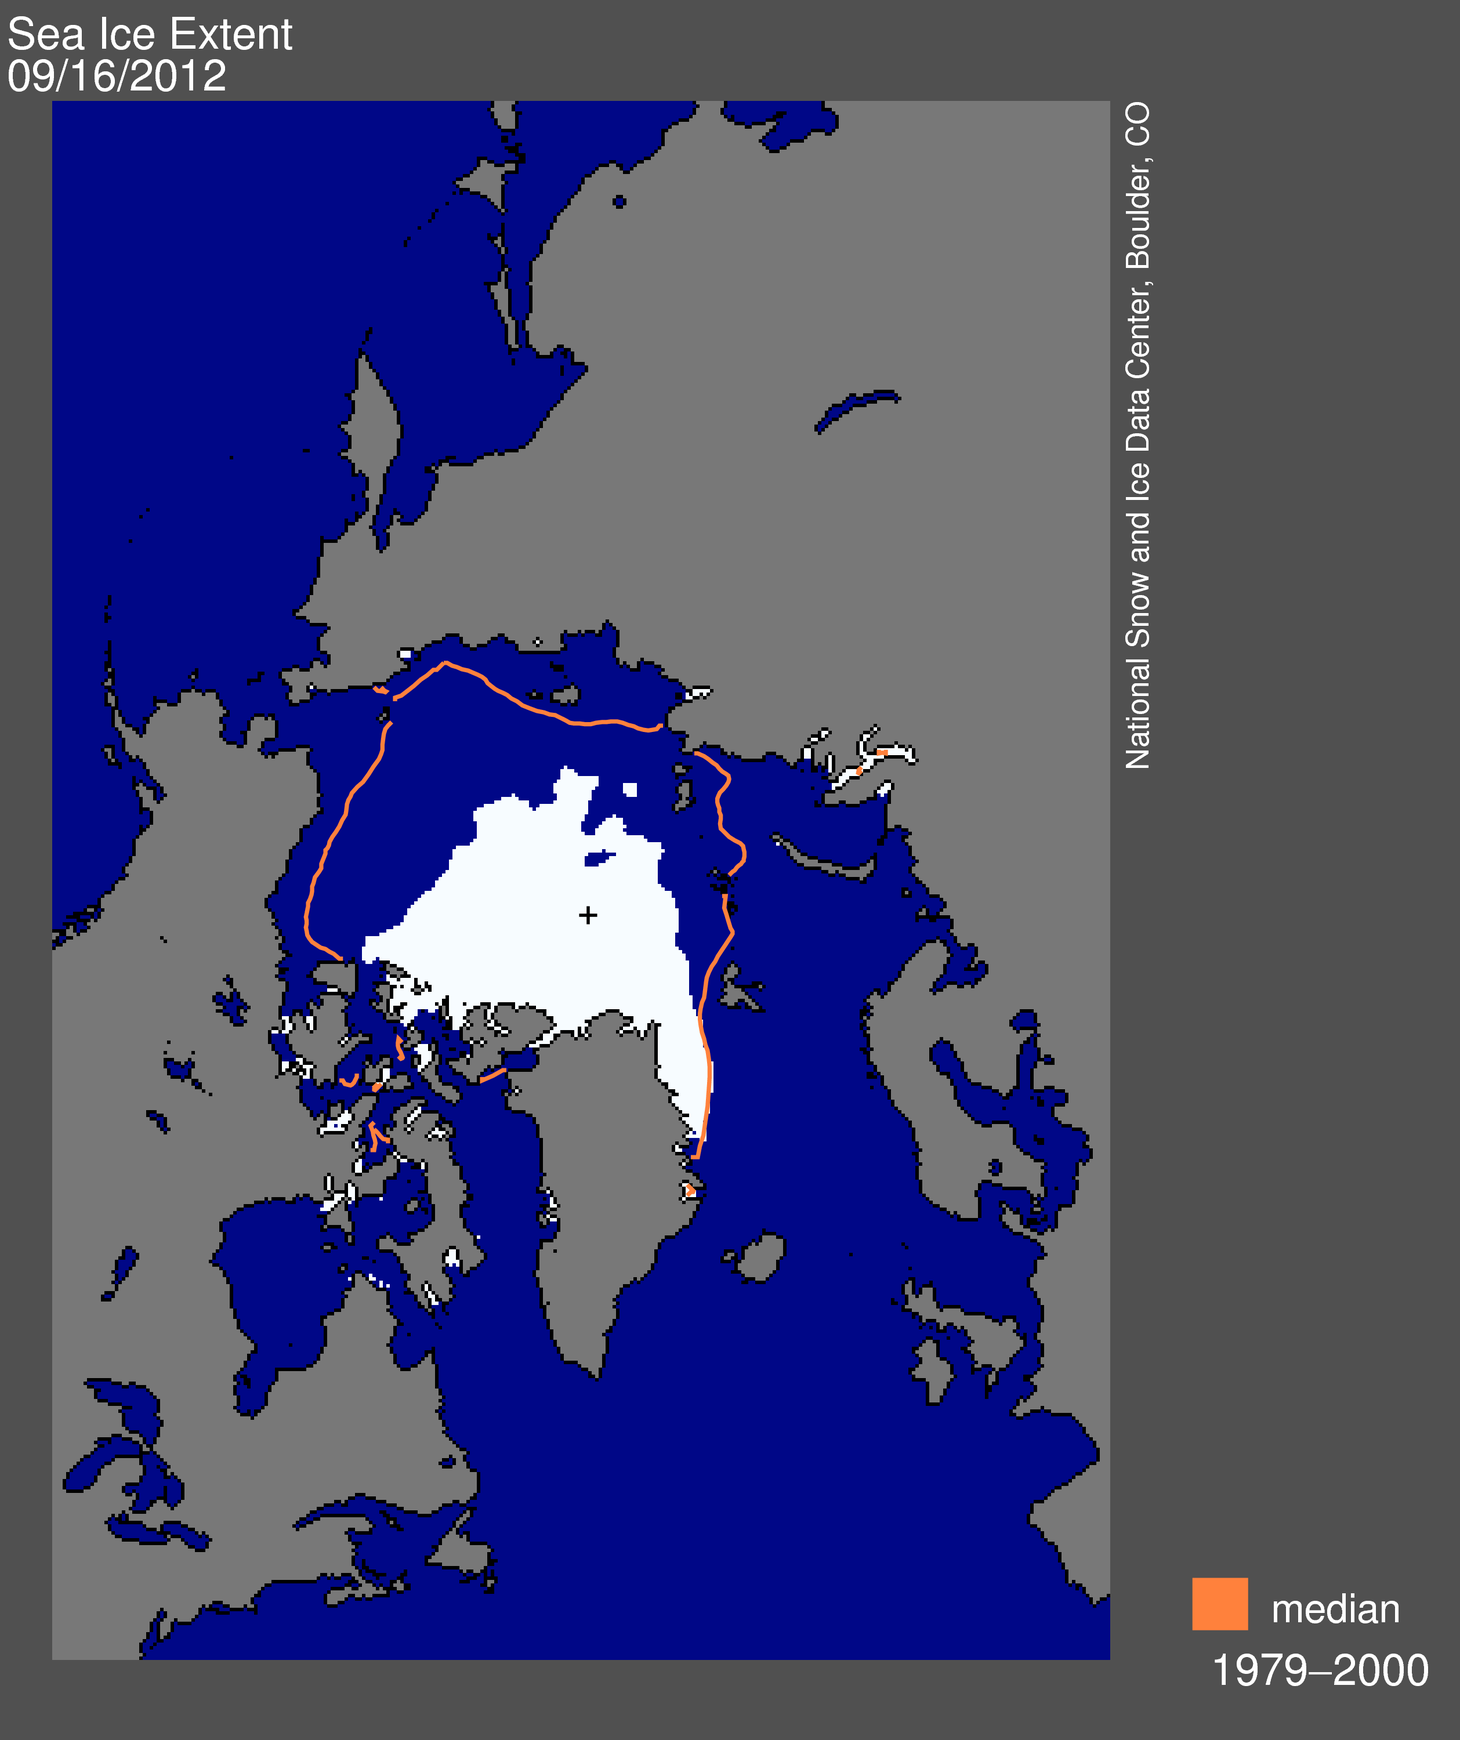
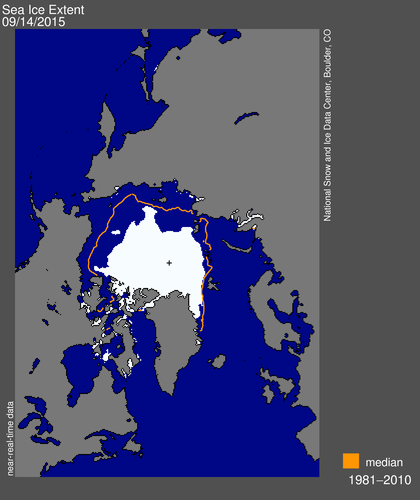
The extent of Arctic sea ice is up 26% from three years ago. Green shows growth since September 16, 2012, red shows loss.
Government funded experts, leading journalists, and Nobel Prize winners all say the Arctic is ice-free.
The End of the Arctic? Ocean Could be Ice Free by 2015 – The Daily Beast
Gore: Polar ice cap may disappear by summer 2014
BBC NEWS | Science/Nature | Arctic summers ice-free ‘by 2013?
Why Arctic sea ice will vanish in 2013 | Sierra Club Canada
Arctic Sea Ice Gone in Summer Within Five Years?
The Argus-Press – Jun 24, 2008


Cue massive influx of Gore-bots with unbelievable fake names …
Like Vending Cart?
Yup.
The Carrion Vending Cart.
Just offal
🙂
Yep your right he was definitely worse than tripe. Though I do have to admit that I have eaten some Menudo that was to die for down in Laredo. http://homecooking.about.com/od/soups/r/blss18.htm
Heh. Buzz off, buzzard, said Katherine.
I love how the left uses the word “scientist” to impress everybody. They depend on the fact that most people flunked science class in school. There are no credentials required to call oneself a scientist. None. You don’t even have to study science, anywhere.
Oh, I’m impressed. A scientist. Two steps below mixologist and on the same level as scientologist and astrologist.
Some of them should be more called scatologists as in experts in feces.
Or Garbologists, like the guys that come by twice a week and empty my trash.
Grantologists.
Yes, Rah,
I applied for membership in the California Research Association for Paleoscatology but I found out it was full of cr…
I think that this is a testament to Al Gore’s tireless work.
They have indeed saved the Arctic, stopped the seas from rising (I assume stopping the incoming tides will be next) thereby saving both the world and the cuddly polar bears.
Congratulations Big Al. “MISSION ACCOMPLISHED”
Now go home.
He pulled off the perfect con. He made money from raising the alarm for something that never happened, then made money on solutions. And then those he conned, still think he’s a hero.
Right now the warmists are claiming this year is the Hottest Year Evah…which is utterly insane.
ems—Where are they getting this data?
Considering it’s not even the 4th quarter yet?
The filled in fall data June-July-August average.
Aw, come on darrylb! You know where they are getting their “data” from! It is a round place, and very dark.
Very interesting, since I ran my wood stove into June. First year evah!
Yep I was afraid my wife was going to have me light up the fireplace this last weekend. But is sure is beautiful here now!
This morning at 06:30 I got up to take the dog out and it was clear as could be and I was comfortable in my sleepers. looking generally a little south of east off the deck in the back of my house was the constellation Orion, a constellation that will be at it’s height during the winter here, was a few degrees above the horizon due east there was Venus, so brilliant and steady it was unmistakable. Just gorgeous!
It was 46F here yesterday in the Sunny South – mid NC and 48F this morning. BRRRRrrrrr.
Your getting what we already had. Hope you get what followed it because it is very nice. As soon as I finish this cup of coffee I’m going to get with finishing the caulking of the flashing on my new windows. Then it’s on to patching mortar on my brick fire place chimney with epoxy grout. Then it’s up on the roof to fix a very small leak around the brick vent for my furnace. With those things done the house will once again be ready for old man winter. But of course I still have some other things to keep me busy during this “staycation”. Get out the generator and fire it up so I know it’s ready. Shuffle stuff from the garage to the new shed and organize it. etc, etc, etc……….. The never ending tasks for a home owner.
Last Republican debate, not one word about global warming. Let’s see what happens tomorrow.
Doubt it will then. Since most people perceive it as a less than important issue they really can’t formulate a gotcha question with it that the electorate would care about.
Too bad the much-touted sea ice recovery has stalled. It seems there’s no going back to pre-2007 conditions, i.e. the time before the 1st collapse…
Why is that? Arctic sea ice is still well above the 2012 low and it seems the minimum has been passed for this year. And this in a year with a powerful El Nino I might add.
And WAY above the Arctic sea ice levels of the first 3/4 or so of the current Holocene interglacial.
Only a really ignorant twit doesn’t know that the Arctic sea ice levels are anomalously high compared to the last 10,000 years….
Is that what you are, skiff.. a really ignorant twit ??
“i.e. the time before the 1st collapse…”
The 1st…….. ever ??? DOH !!!
Skiff is talking about the major storms in 2007 and in 2012 that broke-up the Arctic Sea Ice and drove it out Fram Strait so it melted in the Warm Atlantic. The Arctic multi-year ice has been recovering from those rare events. There have been about eight storms of similar strength over the past 34 years of satellite records. 34 years is only a half cycle so you can not figure a trend. There are ~60 year cycles, 88 year cycles and 200 year cycles.
The ~60 year cycles seem to be the Atlantic and Pacific ocean warm and cool phases.
NASA Finds Sun-Climate Connection in Old Nile Records
Solar variability and climate change’ Geomagnetic aa index and global surface temperature
E.W. Cliver •and V. Borikoff •
Air Force Research Laboratory, Hanscom Air Force Base, Massachusetts
J. Feynman
Jet Propulsion Laboratory, Pasadena, California
Working for NASA means a bow to anthropogenic greenhouse warming is mandatory if you want to keep your job and get published.
Hey Gail, Did you see Don’s post of WUWT.
http://wattsupwiththat.com/2015/09/13/mt-baker-glaciers-disappearing-a-response-to-the-seattle-times/
Interesting history glacier graphs that explains why EVERYTHING from the climate farce has to start in 1979. 🙂
https://wattsupwiththat.files.wordpress.com/2015/09/clip_image004.png
You really aren’t kidding? 26%? The best you can come up with is we are 26% better than the lowest arctic sea ice extent in recorded history?
Quite a DEATH SPIRAL isn’t It??????????
Why don’t you go commiserate with Peter Wadhams instead of trying to salvage the unsalvageable. It just makes you look silly.
Hey, rah. This year the lowest arctic sea ice minimum makes you look silly. And unsalvageable. Are we tracking 2006, like Tony Heller, also known as the Steve Goddard of space science, says we are? No.We are not. We are dipping into a summer minimum that 2006 has not seen since. Mr. Goddard, (an alias that he thinks is cool) is wrong.
Get used to the fact that mr goddard is a phoney. He is wrong. His 1971 ice extent is bullshit. It is “Multi-Year ice extent”. To compare that with current ice extent is simply bullcrap.
I don’t give a diddly squat what you think about Tony or me! What I know is that anyone that thinks that there is or will be some man made global climate crisis because of a little extra CO2 is a moron or a liar or just plain uninformed. It is NOT HAPPENING! CO2 is neither a pollutant or a “climate control knob”.
The AGW hypothesis was falsified a long time ago when the hot spot in the lower troposphere did now show. And yet we have people like you running around trying to defend it and promote it.
I used to try to understand why people like you think they way they do. Now they’re just one of those stinky things I have to scrape off my shoe on occasion to eliminate the stink. So go away. The predicted “death spiral” didn’t happen and does not appear it’s going to and you just can’t get any traction by trying to say that we’re somehow going to all fucking DIE if sea ice in the Arctic melts when it doesn’t even look like it’s going to and even if it did it wouldn’t hurt us.
Man, you really got him going. I wonder if it’s because he doesn’t like himself and would rather be a killer whale.
I think very highly of both you and ‘Steven’. And I understand why you think very little of me. It’s okay. Sometimes, I’m not my biggest fan, either.
Have you ever thought about me? I mean ‘really’ thought about me? I really want you to like me. Would you? Could you? Never mind, fuck you.
You are the one that looks REALLY SILLY… and MORONICALLY IGNORANT.
You put your trend starting at the coldest period in the Arctic in the last 50 or so years….
Yet you ignore the fact that for the first 3/4 of the Holocene, with less a-CO2 than now, the Arctic was mostly ice free in summer.
But ignorance is your meme, it seems.
And you show zero willingness to change it.
Look, I like to protect my personal crap with a phoney name. But I use an obviously phoney name. When Tony Heller decided to protect his personal crap, he chose a name that seemed to be real, and seemed to be cool, Steven Goddard. Now he has to live with it. He chose it not for personal protection, not for personal safety. He chose it because he wanted to be cool. He wanted to be identified with ‘Goddard Space Science Center’, or something very near that ideal.
Now he wants to slam everything about the ‘Goddard Space Science Center’. Oh well.
I’d say named after Robert Goddard, a great rocket scientist, not Goddard Space Science Center, which is a national embarrassment made up of Obama’s henchmen.
There was a time I thought highly of NASA and the GISS. Then they put Hubble up with a bad mirror and suddenly couldn’t calculate trajectories. And then Hanson came along……….. Where have the steely eyed rocket men of the 60’s gone? Those were my kind of people! I do have to say though that I have enjoyed all of the great stuff from the robots on the surface of Mars.
You moronic idiot.
Its to do with HAL. 😉
See if you can figure it out !
1958 (as a control)
http://ocean.dmi.dk/arctic/plots/meanTarchive/meanT_1958.png
Blue line is freezing point. Green line is the average.
2010
http://ocean.dmi.dk/arctic/plots/meanTarchive/meanT_2010.png
2011
http://ocean.dmi.dk/arctic/plots/meanTarchive/meanT_2011.png
2012
http://ocean.dmi.dk/arctic/plots/meanTarchive/meanT_2012.png
2013
http://ocean.dmi.dk/arctic/plots/meanTarchive/meanT_2013.png
2014
http://ocean.dmi.dk/arctic/plots/meanTarchive/meanT_2014.png
2015
http://ocean.dmi.dk/arctic/plots/meanTarchive/meanT_2015.png
Three out of the last six Arctic summers have been cooler than the norm and the rest normal. That sure is a great death spiral NOT!
The graphs are of the area North of 80N, which is almost entirely ice-covered year-round. Temps are right around 0C because the temps are set by the temperature of the ice. As long as there is almost all ice North of 80N, temps will stay close to 0C, as they have done for the whole of the DMI record.
To check changing temps, look at temp values over the other seasons. Wintertime values over long term should give a clue as to whether CO2 warming is happening in the Arctic – but don’t pick a handful of years, pick a lot. A few years will tell you nothing about climatic change (if any).
To be precise:
“Summertime Temps are right around 0C because the temps are set by the temperature of the ice.”
As long as it’s all ice in summer North of 80N, temps will be close to 0C, as they have been in summer for the whole DMI record.
(I emailed DMI about this years ago, and am repeating their reply here)
To be precise:
A peer-reviewed paper published in the Canadian Journal of Earth Sciences finds that Arctic sea ice extent at the end of the 20th century was more extensive than most of the past 9000 years. The paper also finds that Arctic sea ice extent was on a declining trend over the past 9000 years, but recovered beginning sometime over the past 1000 years and has been relatively stable and extensive since.
http://research.bpcrc.osu.edu/geo/publications/mckay_etal_CJES_08.pdf
To check changing temps, look at temp values over the other seasons. Wintertime values over long term should give a clue as to whether CO2 warming is happening in the Arctic – but don’t pick a handful of years, pick a lot. A few years will tell you nothing about climatic change (if any).
That has nothing to do with ice-bound temps North of 80N since 1958.
?
No, but it has everything to do with climate change. No cherries needed.
You get sublimation from the sun. This is a key point.
The papers I just quoted use of 60 N or 65 N when talking of glaciation. This is a direct result of the asymmetry of the planet. It is the sunlight “up north” that melts the Arctic, and that’s all that matters. The Antarctic is too cold to ever melt. The Tropics, well, the sun just wobbles back and forth overhead and it modulates the thunderstorms. It is only the N. Pole that has ice floating on water with land around it. Where the geography allows a hysteresis driven ice cap / no-ice sea. (As it ‘locks up’ in ice, it acts like another Antarctica and ‘never melts’. Then it takes excessive sunshine to melt it, that only happens at the extreme point of the Milankovitch cycles. After that, it acts like open water staying melted… until persistent multi-year ice starts to stay grounded all around and the arctic currents start to be cut off as the water level drops… then it flips back to frozen… Yes, persistent multi year ice and a lower sea level is to be feared, mightily. Yet that is exactly what the ‘always wrong’ AGW folks are demanding to see happen. — My the Lord save us from idiots.
The above freezing temps have everything to do with whether CO2 melts the ice. —- It doesn’t.
You get sublimation from the sun and you get melting from below due to warm sea water.
To continue what gator said.
Abstract
http://adsabs.harvard.edu/abs/2007AGUFMPP11A0203F
Abstract
http://www.sciencedirect.com/science/article/pii/S0277379110003185
Long term glaciers are advancing:
href=”http://climate.envsci.rutgers.edu/robock/MillerArctic.pdf”>Temperature and precipitation history of the Arctic It says: “Solar energy reached a summer maximum (9% higher than at present) ~11 ka ago and has been decreasing since then, primarily in response to the precession of the equinoxes. The extra energy elevated early Holocene summer temperatures throughout the Arctic 1-3°C above 20th century averages, enough to completely melt many small glaciers throughout the Arctic, although the Greenland Ice Sheet was only slightly smaller than at present.”
A study from Norway says the same about glaciers in Norway
A new approach for reconstructing glacier variability based on lake sediments recording input from more than one glacier 2012
ABSTRACT
So the actual data shows glaciers are growing over the long term as the Holocene winds down.
This is what scientists who agree with CO2 causing ‘Global Warming’ have to say:
http://lorraine-lisiecki.com/LisieckiRaymo2005.pdf
http://www.sciencedirect.com/science/article/pii/S0277379107002715
Let’s all pray that CO2 is the magic gas that helps warm the earth because we are now at a solar insolation that could trigger a return to glaciation and the slide down to an ice age is a wild ride with large swings in temperatureeven if the earth doesn’t go fully into glaciation.
In addition during the last glaciation we had carbon dioxide starvation in C3 plants: ‘Carbon starvation in glacial trees recovered from the La Brea tar pits, southern California’ (Department of Ecology and Evolutionary Biology, University of Kansas) and most of our food is C3 like trees and not C4 like grass.
http://biblioteca.universia.net/ficha.do?id=912067
Same lead author on Arctic sea ice in 2014
“Our work points to the strong surface albedo feedback as the common denominator between the sea ice minimum before 6000 years ago and the present diminishing trend. However, at the same time as our simulations show the importance of the surface albedo feedback, there are likely two distinctly different underlying causes for the feedback to kick in: increased insolation (past) and increased GHG levels (present).”
http://www.sciencedirect.com/science/article/pii/S0277379113004162
None of the papers mentioned above posits that the modern decline in arctic sea ice is more a result of natural variability than anthropogenic forcing.
None of the papers mentioned above posits that the modern decline in arctic sea ice is more a result of anthropogenic forcing than natural variability.
There fixed it for you.
The modern day Arctic sea ice levels have declined since the coldest period in the last 50 or so years. ie the late 1970’s.
But they ae still much, much higher than most of the Holocene, ..
except those of the LIA which we unfortunately seem to have stopped climbing out of.
Move to Siberia if you want a return of those LIA conditions..
but you won’t will you.. because you prefer it warm.
“None of the papers mentioned above posits that the modern decline in arctic sea ice is more a result of anthropogenic forcing than natural variability.”
How could they? They are examining Arctic sea ice change pre-industrial.
In papers discussing recent decline in Arctic sea ice the same authors agree it is due to greenhouse warming and possibly some contribution from natural.
But we’ve strayed far from the point I started at – summer surface temps North of 80N are set by the fact that there is sea ice across that area year-round. So you’re not going to see any change in summertime until we see more exposed water North of 80N. The fact that temps are right around 0C every year at the ice-bound North Pole since 1958 should give a clue. The temperature of the ice sets the temperature recorded by DMI – as they explained to me in the email.
Authors say“… at the same time as our simulations show the importance of the surface albedo feedback, there are likely two distinctly different underlying causes for the feedback to kick in: increased insolation (past) and increased GHG levels (present).”
simulations = models = not ACTUAL DATA just a guess made via computer.
Albedo from Earthshine Project:
https://wattsupwiththat.files.wordpress.com/2007/10/earth_albedo_bbso.png?w=640
Note the inflection point at 1997, the year of the grand El Nino.
The past decade [2001 -2010] had the snowiest winters (December-February) on record.
https://stevengoddard.files.wordpress.com/2010/09/2000_decade_snow.png?w=640
September 2014 Snow Cover Was Highest On Record In North America
https://stevengoddard.files.wordpress.com/2014/10/screenhunter_3455-oct-08-22-43.jpg?w=640
Changes in the Earth’s UV reflectivity from the surface, clouds, and aerosols
Continuing with Albedo and earth energy loss.
The closest approach of the earth to the sun is called perihelion, and it now occurs in January when the Southern Hemisphere has its summer. Therefore MORE Antarctic sea ice means more of the earth’s yearly incoming solar energy is reflected.
The Antarctic sea ice extents ANOMALY for the last couple years was very high. For October 2013 it was over 1.5 Mkm^2 of “excess” southern sea ice extents. ALL of this “excess” sea ice was between latitude 60 south and latitude 59 south. ALL of this “excess” southern sea ice extents covered an area LARGER than the entire area of Hudson Bay (also centered at latitude 60), and this EXCESS southern sea covered an area about HALF the size of Greenland (a region centered between 60 north and 80 north latitude). but we barely heard a word from the Alarmists. (Imagine the hysteria worldwide if 1/4 of the Hudson Bay “lost” sea ice coverage! Imagine the hysteria if 1/10 of Greenland “lost” sea ice?)
What does this mean?
At today’s sea ice extents, the “edge” of the Arctic sea is a tiny ring about latitude 78 -82 north in mid-September. The “edge” of Antarctic’s sea ice minimum is also a “ring” – but that ring is about latitude 66 south. Much closer to the equator, much more energy reflected from the Antarctic sea ice, right? Now, at maximum extents, the “edge” Arctic sea ice is at its closest point to the equator is only down to 72 north, not even as close to the equator as the minimum Antarctic sea ice! But at its maximum, Antarctic sea ice extents is much, much higher at 59.2 to 59.0 latitude. Closer to the equator than even the most southern tip of Greenland!
Now, at the equinoxes, when both Arctic and Antarctic are both hit by the same solar intensity, the Antarctic Sea Ice receives between 2x (Feb-March) to 5x (September-October) the energy that the Arctic sea ice receives. Thus, to reflect equal energy into space, the “gain” of even 1.0 Mkm^2 of southern sea ice extents needs to be balanced by a loss 2 to 5 LARGER in the Arctic. Instead, we see near even sea ice changes.
Overall, increased heat losses from open ocean in the Arctic (when Arctic sea ice is at a minimum in late August-September) are much greater than increased heat absorbed into that open water. More sea ice loss in the Arctic => More heat loss from the planet and a net cooler planet.
The opposite happens in the Antarctic: More sea ice around Antarctica means more heat reflected from the planet and a net cooler planet.
So, since at today’s levels of sea ice extents, “more Arctic sea ice loss” up north means a net loss of energy from the planet; and “more sea ice extents gain” down south means a net loss of energy from the planet, we are facing a future big problem. If the trends continue. — (Stolen from RACookPE1978)
Good website!
I guess 1,02 Millions of Square Kilometers are 31% increase from 3,39 in 2012 to 4,41 in 2015… http://nsidc.org/arcticseaicenews/
See also: https://wobleibtdieglobaleerwaermung.wordpress.com/2015/09/17/arktisches-meereis-waechst-kraeftig-eiswachstum-vier-tage-frueher-als-im-durchschnitt/
Cheers
Schneefan2015
It must be 30%…
So 3 years of data is statistically significant? That’s good to know. I decided to check the global temperature trend for the last 3 years to see what’s been happening climatically. To make it 3 exact years with data available, I took it from September 2012 to August 2015.
http://www.woodfortrees.org/graph/rss/from:2012.66/plot/rss/from:2012.66/to:2015.59/trend
Trend is 0.3C/decade. Dayum! Global warming is back!
We prefer at lease 3000 years (enough for 2 D/O – Bond cycles) It is the ClimAstrologists who like a nice short data set that only includes the increasing side of an oscillating curve.
http://i.snag.gy/BztF1.jpg
Negative Feedback? We don’t need no stinkin’ negative feed back!
“We prefer at lease 3000 years (enough for 2 D/O – Bond cycles) It is the ClimAstrologists who like a nice short data set”
Steve’s headline for the OP:
“26% Increase In Arctic Sea Ice Over The Last Three Years”
So his time-scale is not “preferred” by you?
Steve title is a response to the Arctic Death Spiral nonsense we have been hearing for years.
Steve’s a climastrologist?
No Steve is a GEOLOGIST. Actually he has degrees in Geology and Electrical Engineering and worked as a contract software developer on climate and weather models for the US government.
You might even call Steve a ‘whistleblower.’
But he’s relying on 3 years of data. You prefer at least 3000 years and say it’s climastrologists who prefer a “short data set.” Do you now contend that using a 3-year trend is a valid way to proceed?
To be clear – do you think a 3-year tend is a valid period to establish climate change? That’s the question I’m interested in you answering, not some other question.
Again with the moronic strawman.
Point out where SG said there was a trend.
I stated the FACT that there has been an 26% increase in the last 3 years. This is TRUE.
He then stated that many alarmists predicted ice-free by 2015.. and gave examples.
You are proving yourself to be a z class moron, as well as a mathematical illiterate.
Keep digging.. Its fun to watch you.. and it will be on the net for ever. 😉
Typo Correction,,
He stated the FACT that there has been a 26% increase in the last 3 years.
(not “I stated”)
http://i1006.photobucket.com/albums/af185/barryschwarz/last%203%20years%20rss_zps75c8sywi.png
Nice cherrypick there Schwarz. Why not graph the years Gail showed?
http://www.woodfortrees.org/graph/rss/from:2010/plot/rss/from:2010/trend
I wonder if the Schwarz, mathematical illiterate, has figured out what a first degree polynomial is yet.
Did he even pass junior high?
First degree polynomial results in a linear expression, second degree, a simple curve and so on. I finished high school but dropped maths. The linear regression app in Excel is pretty easy to use once the pack is installed.
Yes, Its very obvious you dropped maths.
Your basic mathematical ignorance and lack of basic mathematical understanding is seen in all your posts.
Please.. go and play on twitter or something. !!
https://i2.wp.com/i44.tinypic.com/r7jbdf.jpg
Interestingly, the 2010 El Nino didn’t actually alter the general slight cooling trend much at all
http://woodfortrees.org/plot/rss/from:2001/plot/rss/from:2001.2/trend
Also interesting is that we are apparently meant to be in an El Nino at the moment.
Maybe the spike (and some excitement for the alarmistas) is still to come, but if this current tiny bump is the best it can muster, the following La Nino conditions could see quite a sharp dip.
Time will tell. !
Andy,
Bob Tisdale’s latest on El Nino: https://bobtisdale.wordpress.com/2015/09/21/september-2015-enso-update-sea-surface-temperatures-continue-to-rise-in-the-central-equatorial-pacific/#comment-28392
On temperatures: https://bobtisdale.wordpress.com/2015/09/14/august-2015-global-surface-landocean-and-lower-troposphere-temperature-anomaly-model-data-difference-update/
Although the present El Nino is strong (close to 1997/98) the temperatures have not spiked yet.
What the Alarmist do not realize is an El Nino actually represents a loss of heat to space. Without an ongoing active sun,to ‘recharge the oceans’ it will be interesting to see what the long term effect will be. — El Nino, La Nina, and the Southern Oscillation edited by S. George Philander
Some interesting ideas on El Nino from Tall Bloke et. al
(If you can follow what Paul Vaughan is saying you are doing much better than I! I have been trying for years. I always feel like I came into the middle of a conversation between math genuises who are using shorthand to communicate.)
What is inferred from this is obviously nonsense – a permanent rise in SSTs every time there’s an el Nino (with no “steps” down with la Ninas). If so, then SSTs should have warmed from the beginning of the current interglacial with every el Nino. Over the period in the graph (say 1985-2014), temps rose by 0.3C. Over 7000 years that equates to 70C rise in SST temps.
Obviously Bob doesn’t believe in la Ninas having an opposite effect. Where the rest of the scientific world sees quasi-periodic oscillation, he sees “steps.”
I prefer the one BS did all by himself.
If you ignore his meaningless little red dots , you can clearly see the step change from the 1997-2001 El Nino events, which provided the ONLY WARMING in the whole of the satellite data.
With that one graph he demolishes the AGW meme. He is just toooooo dumb to know it.
http://i1006.photobucket.com/albums/af185/barryschwarz/rss%20trend%201997%20-%202001%20removed_zpsmxiltjc8.png
“Nice cherrypick there Schwarz”
I’m basing it on Steve Goddard’s period – 3 years (read the headline in the OP). Should I have rejected Steve’s inspiration for this? If so, why is Steve wrong to pick 3 years? I’m only taking up his method.
https://www.youtube.com/watch?v=Uif1NwcUgMU
Barry says:
“But he’s relying on 3 years of data. You prefer at least 3000 years and say it’s climastrologists who prefer a “short data set.” Do you now contend that using a 3-year trend is a valid way to proceed?
To be clear – do you think a 3-year tend is a valid period to establish climate change? That’s the question I’m interested in you answering, not some other question.”
>>>>>>>>>>>>>>>>>
WOW, nice strawman you have set up there!
What is actually said.
1. “Government funded experts, leading journalists, and Nobel Prize winners all say the Arctic is ice-free.” [Steve is being his usual sarcastic self.]
2. Examples of statements of Ice free by 2015 are then given.
3. The FACT that the Arctic is NOT ice-free but has instead increased in sea ice over the last three years is then shown.
NOTHING is said by Steve about a 3-year trend being a valid period to establish a trend in the Arctic. On the contrary Steve has repeatedly shown that the Alarmist are the ones doing the cherry picking by using 1979 as a start date to produce a straight line.
More On The Arctic Ice Satellite Scam
https://stevengoddard.files.wordpress.com/2015/05/figure3-350×2701.png?w=452&h=349
https://stevengoddard.files.wordpress.com/2015/04/screenhunter_8822-apr-30-06-28.gif?w=640&h=470
https://stevengoddard.files.wordpress.com/2015/05/screenhunter_9237-may-14-03-48.gif?w=640
https://stevengoddard.files.wordpress.com/2015/05/nimbusjan1976anatrcticvsjan20151.gif?w=640
So quit trying to put words in Steve’s mouth!
“NOTHING is said by Steve about a 3-year trend being a valid period to establish a trend in the Arctic.”
That’s what bugs me. He doesn’t say it is invalid, either.
But what do YOU think? Straght answer… is a 3-year period valid? Simple question, yes?
“On the contrary Steve has repeatedly shown that the Alarmist are the ones doing the cherry picking by using 1979 as a start date to produce a straight line.”
Maybe it’s something to do with the fact that annual satellite data starts from that year. Prior data is much more sketchy, though obtainable, and so sketchy before 1900 or so that proxy data is the go-to.
Surely there’d be an outcry if people just willy-nilly tacked instrumental data onto proxy – isn’t that what critics hate about a certain milennial temp reconstruction?
“…the Nimbus 5 microwave satellite data, which goes back to 1972…. The Nimbus 5 data completely wrecks their story, because it shows that ice in 1974 was no more extensive than it is today, and that NSIDC cherry-picked 1979 as their start date….. NSIDC has no excuse for not using it. It was used in both the IPCC FAR and SAR reports.” — Steven Goddard
I think that is pretty darn clear.
……………….
I also think the following is pretty darn clear:
December 12, 2007 Arctic Sea Ice Gone in Summer Within Five Years? Seth Borenstein
An already relentless melting of the Arctic greatly accelerated this summer — a sign that some scientists worry could mean global warming has passed an ominous tipping point.
So it is ClimAstrologists who are basing a climate trend on as little as ONE YEAR, and it is not just one person either.
“Say goodbye to polar bears and a whole lot of ice. New Research suggests the Arctic Ocean could be ice free by 2015 — Mark Hertsgaard
New computer modeling suggests the Arctic Ocean may be nearly ice-free in summer as early as 2014, Al Gore said today at the U.N. climate conference in Copenhagen.
Arctic summers ice-free ‘by 2013’ by Jonathan Amos
Professor Wieslaw Maslowski told an American Geophysical Union meeting that previous projections had underestimated the processes now driving ice loss.
On March 23 2013, I made the following prediction.
“For the record- I do not think any sea ice will survive this summer. An event unprecedented in human history is today, this very momemt, transpiring in the arctic ocean – Paul Beckwith
Jun 24, 2008 — Hansen, echoing work by other scientists, said that in five to 10 years, the Arctic will be free of sea ice in the summer.
>>>>>>>>>
So has the Arctic been Ice-free in summer? NO!
Has the Arctic continued a ‘Death Spiral’ indicating it will be Ice-free in summer? — NO!
Has Steven Goddard shown these fear mongers are full of Bovine Feces? — YES!
And that dear Barry, is ALL that Steve has done. So stop trying to twist this article into something it is not. Unlike Progressives, realists are not stupid.
Yes, the (qualified) predictions were wrong. Some of those articles also point out that the time to ice-free summer could be longer.
Still no straight answer to a straight question. It would take one word: yes or no. Are you incapable?
“The Nimbus 5 microwave satellite data, which goes back to 1972…. The Nimbus 5 data completely wrecks their story, because it shows that ice in 1974 was no more extensive than it is today, and that NSIDC cherry-picked 1979 as their start date….. NSIDC has no excuse for not using it.”
According to NSIDC:
“The Nimbus 5 ESMR was not used because of the lack of overlap data with the Nimbus 7 SMMR, while the Nimbus 6 ESMR was omitted because of the poor quality of the data.”
https://nsidc.org/data/docs/daac/nsidc0051_gsfc_seaice/TM104647.html
Nimbus 5 data are here:
https://nsidc.org/data/docs/daac/nsidc0009_esmr_seaice.gd.html
Thanks for the reference, Gail. I managed to find the web page. Here is the FAR chart of sea ice Steve posted.
https://stevengoddard.files.wordpress.com/2015/04/screenhunter_8822-apr-30-06-28.gif?w=640&h=470
Steve wrote about this: “The Nimbus 5 data completely wrecks their story, because it shows that ice in 1974 was no more extensive than it is today”
But 1990 is clearly not “today,” so here is a longer-term data set based on various records, including Nimbus 5 for the period 1972 – 77. Data gap was filled using land-based records.
http://i1006.photobucket.com/albums/af185/barryschwarz/1953%20arctic%20sea%20ice_zps9jdabrxo.png
Only up to 2011, though.
Overall the trend is cooling. Since T-rex & Co. vanished, it’s been one long slide down the thermometer.
http://jonova.s3.amazonaws.com/graphs/lappi/65_Myr_Climate_Change_Rev.jpg
http://jonova.s3.amazonaws.com/graphs/lappi/Five_Myr_Climate_Change_Rev.jpg
http://cdiac.ornl.gov/trends/temp/vostok/graphics/tempplot5.gif
http://jonova.s3.amazonaws.com/graphs/lappi/gisp-last-10000-new.png
2007 and 2012 ice loss was due to storm/wind driven ice loss through Fram Strait NOT direct melting. The three years of increase gives a ‘hint’ that there is a recovery from those losses instead of a ‘death spiral’ HOWEVER other factors, like changes in the jets, QBO, ozone, PDO, AMO, sleepy sun, geomagnetic reduction, phase of the Milancovitch and Bond cycles…. also come into play. Are we at a minor jog or at the top of a hump? heck if I know but other data suggests the top of a hump and about to head down. The big question is how far down and when.
Note in the R.B. Alley, GISP2 chart all the warm periods have a relatively sharp peak.
Here is another look at the sharp peaks from China.
Zhang, H., Zhang, Y., Kong, Z., Yang, Z., Li, Y. and Tarasov, P.E. 2015. Late Holocene climate change and anthropogenic activities in north Xinjiang: Evidence from a peatland archive, the Caotanhu wetland. The Holocene 25: 323-332.
http://www.co2science.org/articles/V18/apr/Zhangetal2015b.jpg
Gail,
This one is way too thick to comprehend even the most basics of curves and climate and data..
It is a mental amoeba !!
Don’t know why you’ve changed topic. Weren’t we talking about Arctic sea ice? The Nimbus 5 data is included in the graph I posted above. Seems it not as low concentration as *today*. And there are various reasons why Nimbus 5 data is not tacked onto the later satellite data in most products – lack of data overlap (hence calibration difficulties), low resolution, and can’t sort between land-based and sea-based sea ice. They had to compare/calibrate with land-based data to asemble the graph above. The satellite data from 1979 is continuous and higher resolution, and instruments can separate different kinds of ice (as well as get a temperature of the ice, which Nimbus 5 couldn’t).
I’ve seen 2nd order polynomial fits for Arctic sea ice, too, not just linear fits. 2nd order polys tend to have better fit, suggesting acceleration.
Look at this graph, just from the 1979 to 1990
See the parabola…. …
Now do you understand anything about cycles, lines and parabolas etc.
Or are you going to continue acting like a mathematical moron.
https://wattsupwiththat.files.wordpress.com/2015/09/clip_image004.png?w=640
That’s a smooth of data, not a parabolic function.
And it’s not sea ice.
You moronic idiot !!
I knew wouldn’t have a clue.
Not wasting my time trying to explain.
You are a waste of space. !
Bet you don’t understand what happening in this graph , either.
https://notalotofpeopleknowthat.files.wordpress.com/2015/09/tsgcos-corr_-81-146-41-42-261-10-54-16.png
I understand that the Gish Gallop is alive and well here, with you now presenting Atlantic Multidecadal Oscillation data, probably believing it is cause of global surface temperature evolution. Is your next trick the PDO? Let’s talk about the solar cycles or volcanoes, shall we? Or follow your lead more closely and dump graphs with snipe. That will be so informative. All the curve-fitting exercises we can muster to say ABC.
I’ll try once more, but I doubt you have the intelligence to understand.
These things are all related.
They are cyclic, with a fair bit of chaos
The ONLY reason the Arctic sea ice has been declining since the late 1970’s is because that was the peak of the cycle.
(Climate scientists KNOW this, which is why they feed it to people like you)
This shows in the two graphs above.
This shows in the real temperatures from places like Reykjavik, which also hit a minimum around 1970 after a peak around 1940.
All indications are that the cycle has now hit the bottom.
The AMO particularly shows this. (except its upside down, maybe you noticed,, or not)
It is obvious that you absolutely NO CLUE about any of this at all,
and equally obvious that any attempt to educate you is doomed to failure…
.. because you just DON’T WANT TO KNOW..
You don’t understand a single thing.
That’s your problem.
And its pointless trying to explain, because you thrive on your ignorance.
Gail posted Nimbus 5 data with sea ice concentration in 1974 that Steve G said was similar to “today.” When AMO was cold. Maybe sea ice is not tied to AMO?
https://notalotofpeopleknowthat.files.wordpress.com/2015/09/tsgcos-corr_-81-146-41-42-261-10-54-16.png
AMO peaked in 1998/99 it seems. What did Arctic sea ice do since then? How did we get such a low concentration in 2012?
Schwartz can’t even comprehend a graph
The DUMB is strong with this one !!
Thinks tiny peak in 1998 provided more ocean warmth than the much broader next one.
So NO, fool.. If you smooth the curve you will find the Actual peak is around 2010, right where the turn-around in Artic sea ice started.
And doesn’t know that the 2012 low was because of a cyclone.
But then, he has proven that there isn’t much he does know.
Andy, do not forget the winds in 2007 that drove the Arctic Sea ice out Fram Strait.
Both in 2007 and 2012, it was wind driving the sea ice out into the Atlantic and NOT in situ melting. Something the Alarmists always neglect to mention.
Gail said, “NOTHING is said by Steve about a 3-year trend being a valid period to establish a trend in the Arctic. On the contrary Steve has repeatedly shown that the Alarmist are the ones doing the cherry picking by using 1979 as a start date to produce a straight line.”
Bingo. And then serial tampering/manipulating the data on top of that, especially when choose to they go back further in the… uh… record
LOL. Dyslexic last paragraph. (especially when they choose to)
I didn’t notice until I re-read it a couple of time. 😉
Heh, neither did I. Is there something like reverse dyslexia where the mind puts dyslexic statements right again without making fuss about it? 🙂
Arctic is now higher than 2008, 2011, 2007 and 2012 for the day of the year. And climbing.
The recovery to the Holocene norm seems to be over.
5th lowest concentration of the 35 year record.
Based on a single day of each of five years? Climastrology!
Wow, a 1 in 7 event..
SO F***ING WHAT !!
Your mind is wasteland !!
BTW, according to NSIDC, Sept 21 concentration for 2015 is lower than 2008 Sept 21 – latest date at the moment on the ‘charctic’ graph.
And just to try educate you… (in vain, almost certainly)
Here is a very good proxy for Arctic temperatures over the Holocene.
See that little bump just after the LIA.. That’s now.
https://edmhdotme.files.wordpress.com/2015/05/screen-shot-2015-05-25-at-11-09-40.png
Now if you really wanted to you could go hunting for the REALITY of the current slightly warm period, and actually LEARN something for yourself.
Nah.. that’s NOT going to happen, is it. !
Amazing. Temps were hotter in Greenland when the insolation was stronger in the Northern Hemisphere from orbital variation. How does it look when you get temps at the South Pole for the Holocene? Cos we’re ultimately talking about global temps, right?
YAWN… Find out for yourself.
http://c3headlines.typepad.com/.a/6a010536b58035970c01675ff4dedf970b-pi
Recent temps in the Antarctic are lower than in 1700-1800’s
Beginning of the holocene… apples with apples, please.
Yawn !
AndyG55 says: “Gail, This one is way too thick to comprehend even the most basics of curves and climate and data.”
……………………….
I am afraid you are correct Andy. If he is completely incapable of understanding the DIRECT connection between
https://notalotofpeopleknowthat.files.wordpress.com/2015/09/tsgcos-corr_-81-146-41-42-261-10-54-16.png?w=640
and Arctic Sea Ice then there is no hope he would understand…
or the fact that climate models are barely above a child’s etch-a-sketch because they can’t even model the knowns much less the unknown unknowns.
At this point we have models that are pretty good at a three day forecast and somewhat decent at a five day forecast and that is it. Other wise we are left with trying to identify repeatable cycles like
the Milankovich cycles, Heinrich Events, Dansgaard-Oeschger Events, and Bond Events ( Bond Cycles )and on the shorter term, the 200-year de Vries cycles, 88 year Gleissberg cycles, and 65 year Atlantic/Pacific oscillation.
SEE: NASA Finds Sun-Climate Connection in Old Nile Records
This is what I was trying to get at. The 200 years of high solar activity is just about over.
http://www.solen.info/solar/cycles1_24.png
“The ? 200-year solar cycle (de Vries cycle) is commonly believed to be one of the most intense solar cycles.” (from the google blurb, the following article is paywalled)
The influence of the de Vries (? 200-year) solar cycle on climate variations: Results from the Central Asian Mountains and their global link
O.M. Raspopova, , , V.A. Dergachevb, J. Esperc, O.V. Kozyrevad, D. Frankc, M. Ogurtsovb, T. Kolströme, X. Shaof
German scientists find the same cycle.
Lassen sich zukünftige Erdtemperaturen berechnen?
Horst-Joachim Lüdecke und Carl-Otto Weiss
P Gosselin translates into English:
So there is that STRONG ~200 year cycle again.
The graph from the German original:
http://www.eike-klima-energie.eu/fileadmin/Luedecke_Steinhilber/Bild1.jpg
So you have confirmation of this ~200 year cycle from three separate groups using very different methods.
middle image was:
http://www.solen.info/solar/cycles1_24.png
Does that image show up?
Does for me.
Gees .. look at all those strong solar peaks towards the end of last century. !!
The short one in the middle of that serious ends.. guess when…. late 1970’s !
What did Usoskin call that series.. “Grand Solar Maximum” , wasn’t it. 😉
Solar intensity for the cycle is about the same as the cycle at the beginning of the 20th century. A little less, even. Which means temps now should be about the same as then, or lower.
Also we see a peak at 1960, followed by a fairly regular drop-off in intensity to present, so if it’s all about the sun, we should have seen a corresponding drop in global surface temps.
http://i1006.photobucket.com/albums/af185/barryschwarz/had4%201960_zpse28fthg1.png
Dr. Evan’s notch-delay solar theory suggests a delay.
What is interesting is the theory was released and critiqued on a blog. After much discussion and criticism Dr. Evans says
We are all waiting to see what the revised theory looks like. It should be out shortly.
The moronic idiot called Schwarz strikes again !!
Displays a continued total lack of any understanding.
Incapable of learning is he.
Barry, do not forget you are looking at temperature data that has been adjusted to fit the CAGW theory. The original data looks entirely different. Steve BTW is not the only one working on the original temperature data sets.
Here are three among several:
http://hidethedecline.eu/pages/posts/the-atmospheres-ability-to-accumulate-co2-declined-since-1978-241.php
https://diggingintheclay.wordpress.com/2010/01/21/the-station-drop-out-problem/
https://chiefio.wordpress.com/2009/08/05/agw-is-a-thermometer-count-artifact/
And a favorite of mine It’s Cold, Just Ask The Tomatoes There was a major discussion among realists all over the world about their tomato plants not setting fruit.
“Solar intensity for the cycle is about the same as the cycle at the beginning of the 20th century. A little less, even. Which means temps now should be about the same as then, or lower.”
WOW.. keep the ignorance coming , drone.
That really is probably the most STUPID thing even you have said. !!
The continued lack of any understanding at all..
You said you never did any maths, seems you missed on science and logic as well. !
Only thing you seem to be able to do is meaningless prattle.
Weather station “dropout”: In the early 90s researchers collated undigitzed data and data that was not submitted in the format used by the institute, and converted the formats so that they could be. This brought a large increase in data from stations that did not provide data in usable format (eg, hard copy). The dropout was not a result of rejecting stations from 1992 as many skeptics put it, it was a result of clerical work on old unusable records. Many weather stations around the world still do not provide data in a usable format.
The result of station “dropout” was not to warm the record, but to cool it – something most skeptics never checked properly. This is the result of all stations minus the ones that are used now, for the pre-cutoff period.
http://i1006.photobucket.com/albums/af185/barryschwarz/cutoff_zpsontwsy8o.png
Zehe did the work, too, at Lucia’s skeptical blog The Blackboard. Here’s his result, comparing pre and post cut off stations.
http://rankexploits.com/musings/wp-content/uploads/2010/03/Picture-98.png
http://rankexploits.com/musings/2010/a-simple-model-for-spatially-weighted-temp-analysis/
I have yet to see a dissenting opinion on the “dropout” effect. If you know of any that do this comparison, I’d be interested to check it out. All I’ve seen is (negative) speculation on the fact, never the number-crunching demonstrating that the “dropout” makes the GHCN record warmer.
http://joannenova.com.au/2015/09/scandal-part-3-bureau-of-meteorology-homogenized-the-heck-out-of-rural-sites-too/
A lot of work has been done on the BOM homogenisation adjustments in Australia due to site dropout.
Why is the topic changed so often here? Do you know of anyone else who has crunched the numbers to see the effect of station dropout on the temp record/s, Andy?
Gail,
“Barry, do not forget you are looking at temperature data that has been adjusted to fit the CAGW theory. The original data looks entirely different.”
Ok, show us a raw global data set. Skeptic Jeff Condon and Roman M did this work at the Air Vent years ago. This is what they came up with.
“First the obvious, a skeptic, denialist, anti-science blog published a greater trend than Phil Climategate Jones. What IS up with that…?
There are high trends from GHCN, so high in fact that anyone who questions Phil Climategate Jones temp trends will need to show some evidence. Certainly Phil is an ass, but it no longer seems to me that he has ‘directly’ exaggerated temp trends one bit….
Several skeptics will dislike this post. They are wrong, in my humble opinion. While winning the public “policy” battle outright, places pressure for a simple unified message, the data is the data and the math is the math. We”re stuck with it, and this result. In my opinion, it is a better method.”
https://noconsensus.files.wordpress.com/2010/03/id-plus-hadcrut.jpg
https://noconsensus.wordpress.com/2010/03/24/thermal-hammer/
Or we can pick from 1980 to get regular lowering of intensity and employ satellite lower tropospheric temps only. But I think you already know how that looks.
YAWN.. You remain IGNORANT to the end.
You have NOTHING to add to rational discussion.
I repeat..
THE ONLY reason for the fall in Arctic sea ice since the late 1970’s is that it was the top of the cycle.
That cycle looks like it has now bottomed out.
Linear trend, and parabolic trends are TOTALLY MEANINGLESS in a cyclic system.
They may look pretty but they certainly can’t be used for predictive purposes.
DO
YOU
UNDER-
-STAND !
..
Can we hear a big NO from the BS. !!!!
“THE ONLY reason for the fall in Arctic sea ice since the late 1970’s is that it was the top of the cycle.”
My question is, why does the Nimbus 5 sea ice data (posted by Steve G from FAR, link above) have concentration in 1974 similar to *today,* when 1974 was at the opposite phase (cold) for the AMO? If AMO determines sea ice concentration, then 1974 should have been a year of very great extent coverage, as the AMO was near the trough of its coldest phase.
(You’re replying in-line to a discussion on solar variation, not AMO, so your post is a little odd here. You’re referring to AMO, right?)
Yawn
barry says: “Solar intensity for the cycle is about the same as the cycle at the beginning of the 20th century. A little less, even. Which means temps now should be about the same as then, or lower”
Nope, doesn’t work that way. If you put very hot water in a kettle on the stove and a kettle of very cold water and apply the same amount of heat to both kettles, will the temperatures of the kettles be equal 2 minutes later?
Yes, Gail, there should be some lagged effect. I’ve seen it put at about 2 years, owing to the diurnal (24 hour) cycle, and that at 11-year changes in solar intensity it’s only the first few hundred metres of ocean that is affected.
What lag do you think there is from changes in solar intensity?
If 200-year cycles, as you put it, what is the lag time of SSTs for that period?
barry says:
September 23, 2015 at 4:01 am
Solar intensity for the cycle is about the same as the cycle at the beginning of the 20th century. A little less, even. Which means temps now should be about the same as then, or lower.
——————————————————————————————————
Actually according to NASA this cycle 24 is the lowest since cycle 14 in 2006. BUT that is really correct. If one used the same optics and methods we have now in 1906 the count then would have been higher.
71% of the earths surface is covered in water Barry! Why does your local lake, pond, or river appear to steam when the air suddenly cools? Think about that! The fact is the earths surface water of which over 96% is in the oceans, are the great regulator and buffer of earths temperatures.
Right now, more than usual the Pacific is giving up it’s residual heat in an El Nino. That heat has been retained since the last set of solar maximums. We have now an El Nino that showed a spike in the ENSO a few weeks back to about the same level as the El Nino of 2008-09. Yet the lower troposphere is not warming to near the same level it did then. Care to give tells us why Barry?
“cycle 24 is the lowest since cycle 14 in 2006”
umm .. wrong date , rah 😉
If the solar scientists are correct, SC25 could be VERY low.
With all the destruction wrought on the real electricity supply systems by the green non-renewable non-energy crap, a lot of EU countries could be in a lot of bother.
At least all those Syria ISIS members will probably decide home was a better place, warmer, that’s for sure. !!
Americans are also going to be in a world of hurt since all the ‘excess’ capacity has been shut down and in 2013 we almost had massive blackouts. This year even more plants shut down and they are destroying them so taxes do not have to be paid on the buildings.
http://instituteforenergyresearch.org/wp-content/uploads/2012/08/CoalRetirements.png
http://instituteforenergyresearch.org/wp-content/uploads/2012/08/CoalRetirementsTable.png
http://instituteforenergyresearch.org/wp-content/uploads/2012/08/CoalRetirementsMap.png
Natural gas fired plants are supposed to take the place of Coal according the the IPCC scenarios written by Shell Oil VP Jed Davis, but the Protesters are having none of it. (Seems the brain washers did too good a job.)
BURRILLVILLE, R.I. Activists Lock Themselves to Construction Equipment to Protest Fossil-Fuel Expansion
“A coalition of public health advocates, clean energy supporters, conservationists, and students will stage a noon protest on Sunday, November 24 outside of the Mountainview gas-fired power plant. The protest is a response to state officials’ efforts to construct more gas-fired power plants in Southern California.” – link
The next few winters should be interesting.
Just noticed your question, Rah.
“We have now an El Nino that showed a spike in the ENSO a few weeks back to about the same level as the El Nino of 2008-09. Yet the lower troposphere is not warming to near the same level it did then. Care to give tells us why Barry?”
Do you mean 1997/98? 2008/9 wasn’t an ENSO period (started with la Nina 2008, neautral for the latter half of the year, 2009 started neutral, ended with el Nino).
http://www.cpc.ncep.noaa.gov/products/analysis_monitoring/ensostuff/ensoyears.shtml
If you mean to compare with 1997/98, current el Nino has not been, but may yet be, as strong. This may already be demonstrated in the surface data, which has had very warm months/record-breakers lately.
For the lower trop temps (MSU data, bottom 4km of atmosphere), there is usually a lag with ENSO events of 2 to 3 months compared to surface. Even so, I’m not sure why it’s not showing in the most recent MSU data very much (months have been warm, but not exceptional), and I would be surprised if it didn’t show more prominently soon. As ENSO is very well tracked, I would question the MSU data if the current Nino did not make its presence felt more obviously in satellite record.
(FTR, RSS considers land-based temp records more reliable than satellite-derived record – both have significant issues to overcome)