
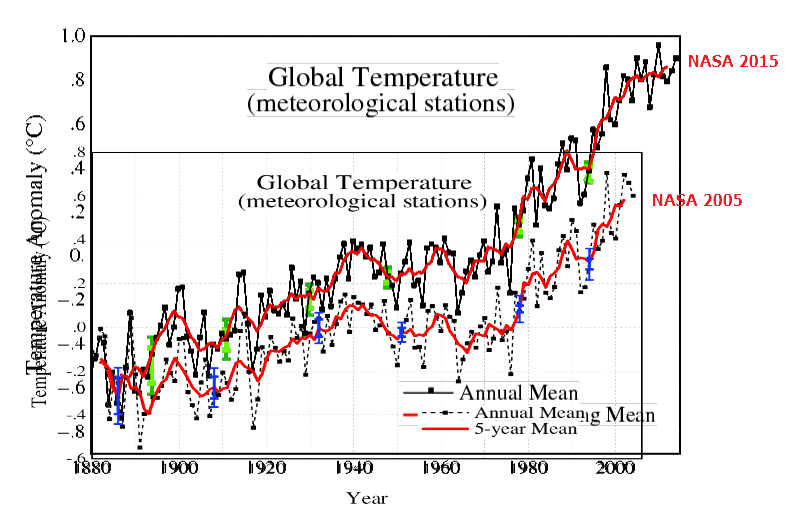
In 2005, NASA only showed 0.75C warming from 1880 to 2002
That wasn’t going to scare anyone about the mythical two degrees, so they changed the data to show 1.2C warming from 1880 to 2002
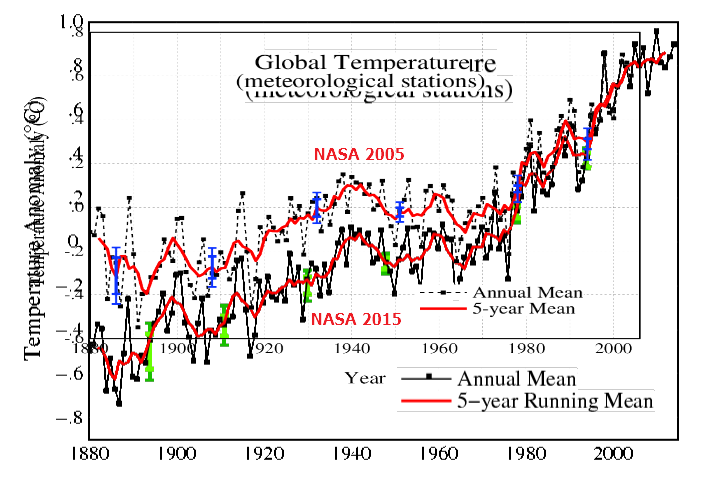
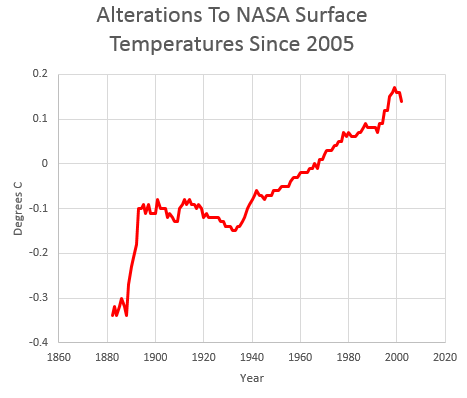
The next graph overlays the 2005 and 2015 versions, normalized to the 1880s. This view shows the massive alterations which NASA has made over the past ten years, which sit on top of all of their earlier massive data tampering.
Here is another view, which normalizes the data to the most recent common decade
Almost half of current global warming is due to the data tampering NASA and NOAA have done, just since 2005.
Gavin understands that he is working with a huge data set that is very difficult for most people to analyze, and that he can basically do whatever he wants to it and get away with it.

Hmmm, I suppose this data manipulation was Peer Reviewed and approved.
A little thought experiment on the 0.5 difference or even the 1.25 difference.
Sioux Falls, SD Annual Average Temperature: 45.6°F or 7.6 °C
Lincoln, NE Annual Average Temperature: 51.5°F or 10.8 °C
Iowa City, IA Annual Average Temperature: 51.2°F or 10.7 °C
Sioux Falls to Lincoln is 236 miles by road.
If there is a 3 degree average increase in 236 miles, how far north do you have to drive to see the same temperature?
all data from – http://www.usclimatedata.com/
They should be in the Penn.
I agree with E.M. Smith’s identification of this basic requirement for us to retain contact with reality and basic constitutional rights:
“The truth, the whole truth, and nothing but the truth.”
https://chiefio.wordpress.com/2015/10/23/pondering-a-funding-campaign/
Is crowd funding a viable solution? I posted the link on ResearchGate for others to consider:
https://www.researchgate.net/post/Is_there_convincing_evidence_of_AGW
Steve — a serious request. Rather than using graph images and overlaying them, why not find the original data that makes up each graph and re-creating them with overlapping lines in a new graph? Overlapping image files come across as a bit amateurish.
Reblogged this on Climate Collections and commented:
NASA’s data creep. Quite troubling to see historical data changed to suit the CAGW narrative.