
NOAA claims that their Arctic ice records began in 1979
Warmer air and sea, declining ice continue to trigger Arctic change
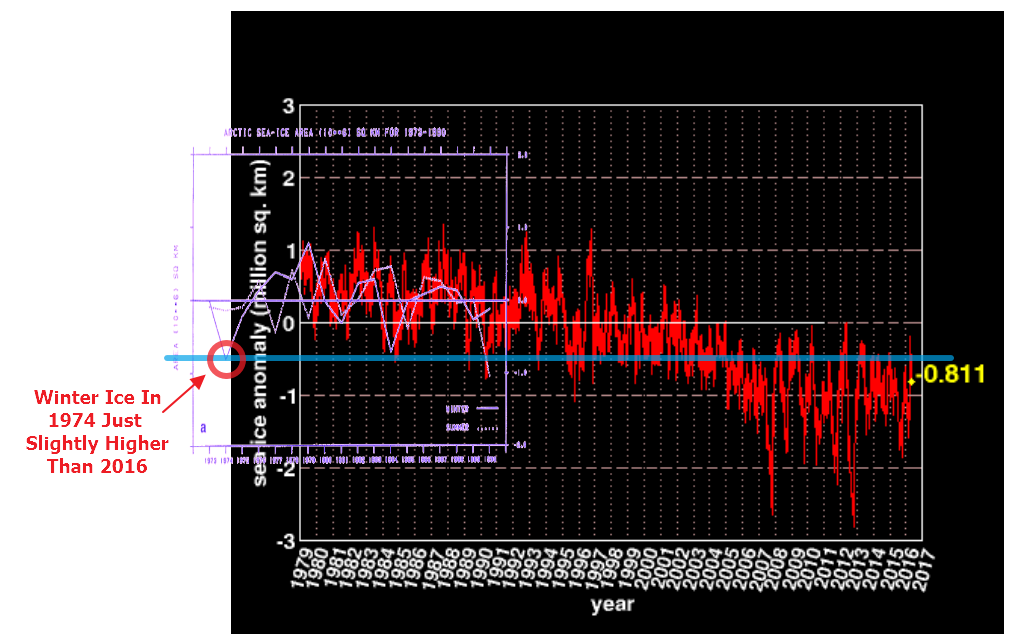
This is not true. They have records going back to at least 1973. Winter sea ice in 1974 was nearly two million km² lower in 1974 than it was in 1979.

climate-assessment-1981-1990.pdf
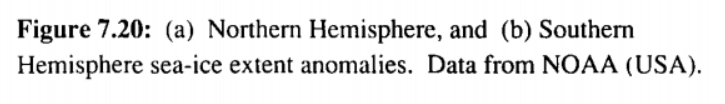
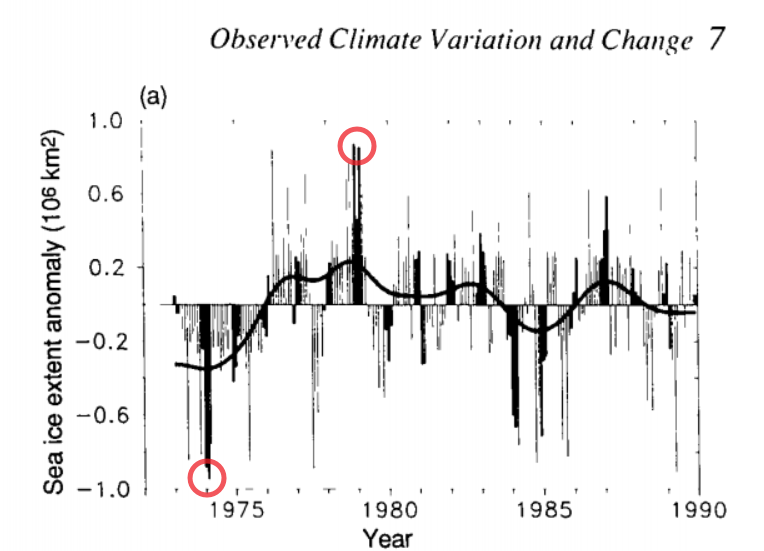
The 1990 IPCC Report showed the same thing, in more detail.
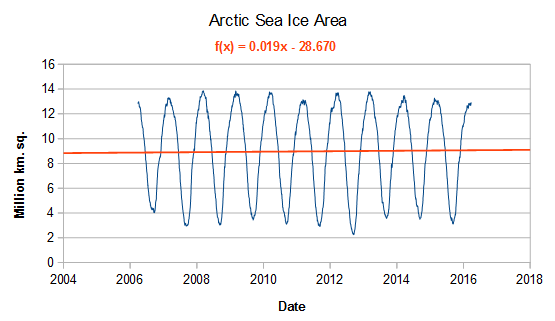
I overlaid the NOAA 1979 to 1990 Arctic ice area graph on the current UIUC graph below, and it becomes clear why NOAA doesn’t want you to know about the pre-1979 data. Winter ice area in 1974 was only slightly larger than this year.
iphone.anomaly.global.png (512×412)
NOAA wants you to believe that Arctic ice is declining linearly, when in fact it is cyclical. We keep hearing hysterical pronouncements about Arctic sea ice from government agencies, when in fact there has been no net change over the past decade.
arctic.atmos.uiuc.edu/cryosphere/timeseries.anom.1979-2008
The Arctic lost a lot of multi-year ice due from 1988 to 2007, due to winter winds blowing the ice out into the North Atlantic. This pattern has reversed, and the winter ice is being retained now.

You’re right, Tony. The 1990 IPCC FAR reported on p.224 that:
“…satellite observations have been used to map sea-ice extent routinely since the early 1970s. … Since about 1976 the areal extent of sea-ice in the Northern Hemisphere has varied about a constant climatological level but in 1972-1975 sea-ice extent was significantly less. In the Southern Hemisphere since about 1981, sea-ice extent has also varied about a constant level. Between 1973 and 1980 there were periods of several years when Southern Hemisphere sea-ice extent was either appreciably more than or less than that typical in the 1980s.”
The IPCC’s 1995 SAR also mentioned the early (pre-1979) satellite measurements (WGI p.150), but more recent IPCC Assessment Reports do not.
The most important pre-1979 data are from Nimbus 5, the first satellite with a scanning microwave radiometer which could view ice through clouds. It collected data from December 11, 1972 through May 16, 1977. I thought that data was lost, but NSIDC has Nimbus 5 sea-ice concentration data through December 1976 available for download, and associated documentation. I don’t know what happened to the January-May 1977 data, and I don’t know why the last three IPCC Assessment Reports have not utilized the 1973-1976 data.
I note that Antarctic ice anomaly is +1.7 sqmillion km whereas arctic is still -0.8
Add the two together and you will find the net effect is [global] cooling
I told you it is globally cooling, didn’t I?
In fact, it seems to me here, in South Africa, it never ever got any warmer.
John Casey. Global cooling?
https://youtu.be/miIEAOAOgyI
The sun is not “cold”
it is hotter and brighter now than in the past 87 years
Earth’s atmosphere has been put together in such an ingenious way
that it defends itself against the onslaught
which will result in a nett cooling effect.
Live with it and the droughts that will come with it
Henry historical reconstruction of TSI does not agree with your claim that the sun ” is hotter and brighter now than in the past 87 years”.
http://lasp.colorado.edu/home/sorce/data/tsi-data/
http://lasp.colorado.edu/home/sorce/files/2011/09/2016-TIM-TSI-Reconstruction-300×225.jpg
Hi Rah
I don’t trust TSI because there is no material probe available that can really measure the most energetic particles coming from the sun without self destructing after some time…..
So, as a consequence, I would also not trust any historical reconstructions of TSI.
The decreasing solar polar field strengths is telling it all and if you know something about nuclear fusion you should be aware that lower magnetic field strength means that more of the most energetic particles are able to escape from the sun.
Anyway, where exactly is TSI measured?
The TSI at the source I provided has been measured by satellite at a distance of one AU from the sun or IOW approximately earth orbit. This has been going on since 1983 which BTW covers a period when TSI was higher than it currently is. Go to the link I provided.
NOAA and ISIS have much in common…
https://www.youtube.com/watch?v=Kg9R68exCEI
Reblogged this on Climatism and commented:
The Arctic “death spiral” alarmist fear mongering campaign, exposed unequivocally right here…
The warmunists, warmunistas, alarmists, heatmongers call ’em what you want, know they are cherry picking, exaggerating, and bullshitting. They also know that they are getting away with it, that they will continue to get away with it and that no amount of evidence to the contrary will ever see the light of day.
I will pony up my $15 to see “Climate Hustle” this coming 2nd of May and with much loathing I will watch the nightly TV news on the 3rd to see how they manage to marginalize if not just plain ignore the event.
I’m certain that even if it is a smash hit, the LSM will totally ignore it. Just wondering, how much advertising will be done to promote the movie?
Reblogged this on Climate Collections.
Surely you must have realised by now “Steve” that “they” have records going back well before 1974? “They” are of course referring to the “Sea Ice Index” which “they” say:
Is a source for consistently processed ice extent and concentration images and data values since 1979.
https://nsidc.org/data/seaice_index/
And so “they” act as if no previous data exists because if “they” didn’t “they” would have to “adjust” it just like “they” have the temperature records so that older data does not conflict with the dooms day, we all gonna drown from melting ice fairytale “they” are required to promote now. BTW do you show that older data at your blog Jim? Do you ever show the articles from the last century when arctic ice was obviously way down for a couple of periods?
Of course he doesn’t. He is too cowardly to do even that.
He still refuses to admit that there was often ZERO summer sea ice during the first 3/4 of the Holocene, and that the only reason the Arctic sea ice is so anomalously HIGH is because it is still trying to recover from the COLDEST period in the last 10,0000 years.
RAH – Google “SMMR” and let me know what you discover.
I do indeed show older data. See my message to Henry.
We’re also having a fun discussion about Franklin’s doomed Northwest Passage adventure. Is that the sort of “last century” stuff you had in mine? If so see:
http://GreatWhiteCon.info/2016/04/the-northwest-passage-in-2016/
No, but since your obviously having a problem understanding plain English (ie:”Do you ever show the articles from the last century when arctic ice was obviously way down for a couple of periods?”) I won’t bother you anymore for now.
Hi Jim
I was still waiting for your answer on where the records are for arctic ice extent that you claimed exist from before the 1950’s
\
[not the reconstruction]
HenryP – I answered weeks ago:
http://GreatWhiteCon.info/2016/03/hadisst-historical-arctic-sea-ice-data/#comment-214030
I dont see the original data of arctic sea ice content?
Before 1950
Plse
From the references in the HadISST “user manual”
Walsh Northern Hemisphere Sea Ice Concentration Charts – These are end-of-month sea ice concentration fields for the Northern Hemisphere for 1901–1995, covering the Arctic Ocean and peripheral seas, assembled from a variety of sources [ Walsh, 1978; Walsh and Johnson, 1978; Walsh and Chapman, 2001]
National Ice Center Charts for Both Hemispheres – Quasi-weekly sea ice concentration and extent for both the Northern (90 to 45 N) and Southern (90 to 50 S) Hemispheres for 1973–1994, were digitized by the U.S. National Climatic Data Center (NCDC) from hand-drawn U.S. National Ice Center (NIC) analyses [ Knight, 1984]
“Walsh Northern Hemisphere Sea Ice Concentration Charts – These are end-of-month sea ice concentration fields for the Northern Hemisphere for 1901–1995”
I’m guessing they used steam-driven satellites pre-1950’s.
You guessed wrong Dave. See my April 17, 2016 at 8:23 pm. I guess you didn’t read that far?
@RAH
like I said\
I would not trust anything from the probes,
that they would be able to measure real TSI
it is an illusion
The sun’ s TSI is chi square distribution that is constantly moving right and left, up and down depending on the solar polar magnetic field strengths
I can further prove this from my own observations:
I arrived in this country exactly 40 years ago and the sun definitely feels hotter now at midday than it felt then.
Like I also observed from my own analysis of data in southern Africa:
there has been no warming here whatsoever:
https://i1.wp.com/oi58.tinypic.com/2mnhh74.jpg
so: the sun has gone warmer
earth is cooling
ergo: the atmosphere is changing…..
https://i2.wp.com/oi61.tinypic.com/ju7fw9.jpg
you can see the composition of at least one gas TOA that has changed since 1995….
@Jim Hunt
Dear Jim\
I cannot work with “quasi”
you have to come to me with actual data, as recorded, before 1950
Why do you do you reference me to papers where those data are not published?
You’re a hard man to please Henry.
I’ve linked to the data. I’ve linked to the papers that explain the data. What more do you want? Photocopies of the original pieces of paper?
https://nsidc.org/data/docs/noaa/g02203-dmi/
Yes, some people are soooo hard to please…
https://i.ytimg.com/vi/Er1kTF3smOE/hqdefault.jpg
“You’re a hard man to please Henry.”
Just tell the WHOLE TRUTH for once in your sad existence, Jimbo.
Bet you can’t. Waiting.
the planned boat trip to try the NW passage will end in disaster
mark my words
just like that of Willem Barentz
“The very best cruise ship in the world” is a bit bigger than a mere “boat” Henry! There is certainly a non zero probability that there will be problems. They have now announced that they have hired dedicated icebreaker support:
http://GreatWhiteCon.info/2016/04/the-northwest-passage-in-2016/#comment-214287
you have no clue what you are talking about….
it was not so long ago that same kind of boat got stuck in the Antarctic….
I have a variety of clues about what I’m talking about Henry, and I am quoting from the Crystal web site. Take it up with them should you disagree.
as far as your ship is concerned,
most surely they will be rescued from the ice once they get stuck
so I am just going to LOL when it happens
I am not sure if anyone here knows what happened to the ship that got stuck in the Antarctic?
Look, those figures are correct, in fact the World didn’t even come into being until 1979, and that was the year Katherine Hey-Hoe was spawned, oops I meant born !
And what that Hoe says is gospel, call it the Gore-Gospel !
And few know the Al Gore is the greatest theoretical scientist that the World has yet to see since the creation, April 1, 1979 !!
And we should all chip in to purchase Al Gore (And Katherine Hey-Hoe) a brand new 787 Jumbo Jet, so Gospel-Gore can roam our planet preaching, oops I meant “teaching” us the Gospel, and doing so in Luxury, and at the tax payers expense, because He rightly deserves so !!!
Let’s just call him, Reverend Al, like when He appeared on Married with Children, in 1995, just 16 years after the creation!
Sincerely yours
A lost theoretical sheep…
Hey ricks! I know that neither of us is the first to comment on the, uh, “reliability” of information received from Gore and the CAGW crowd. It is just so confusing to me how warmists can continue to trust people like Gore and De Caprio and the various “scientists” who jet-set around the world while proclaiming that CO2 is destroying the biosphere. Personally, I cannot see any reason to credit Goer et al with any ethical or ideological stature. If Gore actually believes what he is saying, then his extreme production of CO2 shows that he has no concern with the fact that he is destroying the planet. Why should I trust someone with no ethics? If Gore does not believe what he is saying, then why should I believe what he is saying?
@Jim Hunt
your fig. 1 there says: presumed but not observed arctic sea ice extend….
LIVE WITH IT. THERE ARE NO SATELLITE OBSERVATIONS OF ICE BEFORE THE 1950’s
just like there are no re-calibrated thermometers before the 1950’s
@gator 69
I think that last remark of yours is in rather poor taste.
please apologize or leave this discussion
If you think my post was in poor taste, then you have niether a brain or a heart. Alarmists are accessories to murder, assisting in the starvation of seven million humans every year. Maybe if you draw a graph of the carnage, you will understand it better.
Henry – Of course there are no SATELLITE observations before the 1950s. There are other sorts of observations though.
Gator – An impressive apology!
I didn’t see any “apology”.
Wow Jim! A new low for you?
Who should I apologize to, and for what?
Apologize to Gaia for attempting to save seven million innocent humans each year?
Keep mocking and supporting this mass carnage, it makes you look noble and smart.
Hi Jim
is what I am saying:
you cannot compare Av. T taken before 1950 with Av. T taken after 1973
because of the change in recording
a) from humans to machines
b) from un-calibrated to re-calibration at regular intervals
Likewise you cannot compare ice extent before 1979 with ice extent before 1950…..
The people in the whole of western Europe were struggling to survive during the war, especially 1944 when it was very bitterly cold. Do you honestly think somebody was watching how much ice there was around the north pole? You must be joking.
People like you desperately want to cling to their beliefs and compare apples with pears only to end up looking at hopeless graphs.
If you want to see something: stay with data after 1973. Look at the rate of change rather than anomaly, as this eliminates a lot of error.
https://i0.wp.com/oi62.tinypic.com/33kd6k2.jpg
As you can see: minima are not rising which means there is no man made global warming. Live with kit.
Live with it……
Likewise you cannot compare ice extent before 1979 with ice extent before 1950…..
should read
Likewise you cannot compare ice extent AFTER 1979 with ice extent before 1950…..
sorry.
Reblogged this on Roald J. Larsen.
Also, look at the fig 7.20 1980 data. It has been erased in the current NOAA graph.