
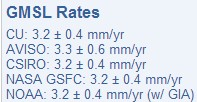
According to the experts at the University of Colorado, everyone agrees that sea level is rising 3.2 mm/year
They are using that new kind of climate math (Common Core inspired) where almost all locations are below the mean.
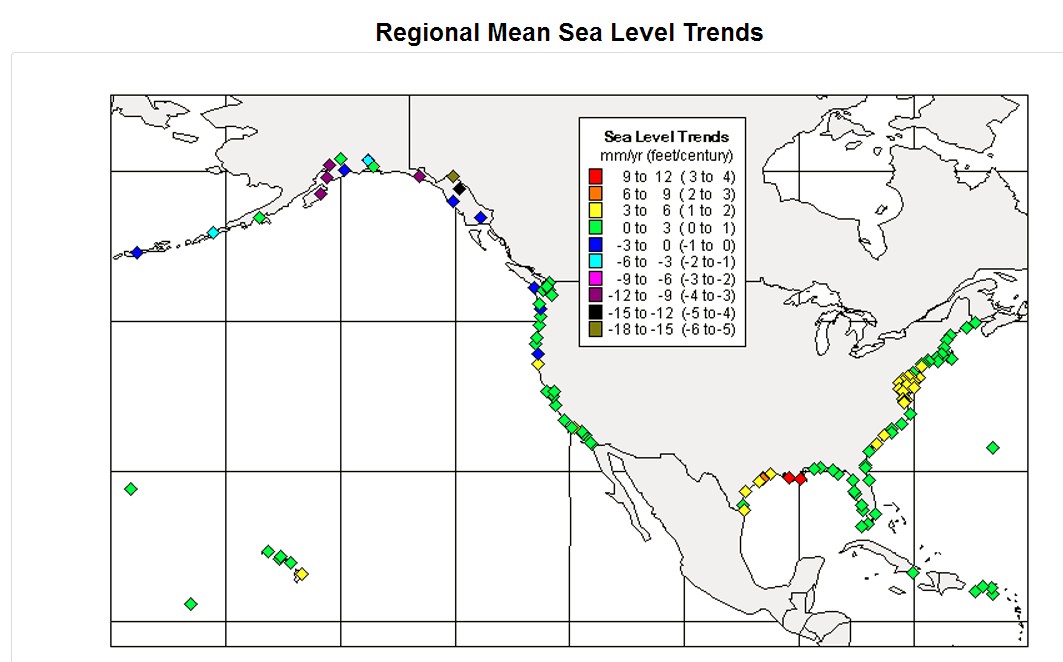
Regional Mean Sea Level Trends – NOAA Tides & Currents
Like I always say, you simply can’t make up fundamentally stupid like climate experts. They have to work hard at it.

This must be due to the inverse Lake Wobegon effect where “All the women are strong, all the men are good looking, and all the children are above average,”
https://en.wikipedia.org/wiki/Lake_Wobegon
You seem to forget that the land is floating. Only the additional weight of cities and people causes an apparent sea level rise. Otherwise, how would Guam be able to tip over?
and don’t let them fool you…there’s no metric for “0”
“0”, no sea level rise at all, will still show up as positive and/or sea level rising
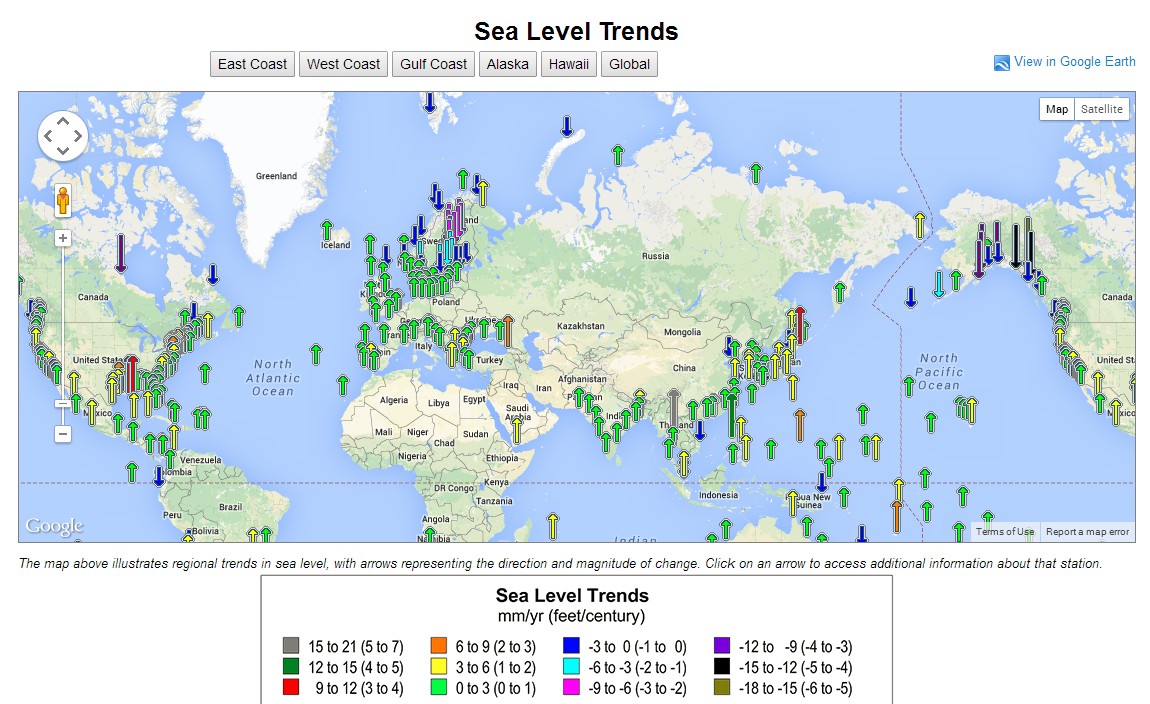
What do the arrows represent? The land moving or the water moving?
Yes.
(I love these kind of questions.)
There is no way to distinguish that from a tide gauge. You need GPS data paired with the gauge to figure that out.
Hi Tony
Off topic but I was wanting to extract Australian regional data from RSS as you have done in http://stevengoddard.wordpress.com/2013/11/05/rss-shows-no-warming-in-australia/
What program can I use.
Neil Gibson
I’m not sure. I use the RSS monthly data which includes a column for US temperatures, but doesn’t have a separate column for any other countries.
No no. It just means that somewhere the sea level is rising pretty darn fast to compensate all those not-so-fast trends. I wonder if you could find such a bulge in the sea with Google Earth?
CU’s Sea Level Research Group also rewrites the historical data.
Hey, don’t they also need TOBS adjustments for reading tide gauges?
Rejigging your headline and opening line =
University of Colorado Below The Mean in Climate Math at Almost All Locations
Am I missing something here… Is this adjusted data or “modeled” sea level rise?
Previous posts on here showed raw data from tide Gages to show no Sea Level rise on the west coast… While the East Cost had higher levels… Meanwhile many of the oldest tide gages across the globe show no rise for 100+ years…
An awful lot of green arrows pointing up on this chart.
Phil, see my post above………
It comes from Calypso Louie’s Million Man Math.
There is a google earth layer you can use that links to sea level tide gauges world wide. It is informative. Just raw gauge readings, for many years in some cases.
Even a Harrier will have difficulty climbing at the rate necessary to make Big Al’s sea level rise by 2100 look even remotely possible – and that is at the “agreed” 3.2 mm /year rate !