
In 2007, the IPCC predicted with 100% confidence, shrinking sea ice at both poles. How did they do?
![]()
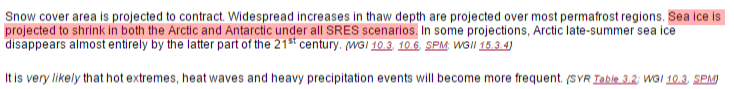 AR4 SYR Synthesis Report – Figure 3.2
Sea ice at both poles has increased since the world’s leading experts made their forecast.
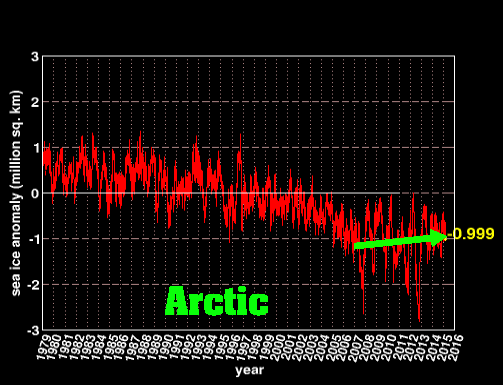
iphone.anomaly.arctic.png (512×412)
President Obama wants to make it illegal to dispute expert projections.

Every time I look at one of the “long term” sea ice area plots I wonder if it really displays an apples to apples comparison over the various years, or is it subject to the same “adjustments” and improvements that infect the temperature record.
Take this little note for Example:
Time Series of Sea Ice Extent
The diagrams below show sea ice extent data since 1979. The complete time series is composed of observations from different sensors, using different sea ice concentration retrieval algorithms and adaptations to each other using certain overlap periods:
#_Period_Algorithm_Sensor, Frequencies, Source_Adapted to_Overlap period
1. 1972 – 2002 NASA Team SMMR & SSM/I, 19 and 37 GHz from NSIDC(1) #2. 1989 – 2002
2. Oct 26, 1978 – Dec 2010 NASA Team Sea ice concentrations from NIMBUS-7 SMMR and DMSP SSM/I-SSMIS passive microwave data, 19 and 37 GHz, from NSIDC(2) reference only, but not part of the time series because of some gaps 1978 – 1988
3. 2003 – Oct 4, 2011 ASI AMSR-E, 89 GHz #2. 2002 – 2007
4. Oct 5, 2011 -Jul 2, 2012 ASI SSMIS F-17, 91 GHz #3. Sep 2010 – Sep 2011 (using SSMIS F-17 data)
5. Jul 3, 2012 to date ASI AMSR2, 89 GHz #3. (same fit parameters used) Jul 3, 2012 to date
(1): Merged ESMR, SMMR, and SSM/I-SSMIS Sea Ice Extent from NSIDC
(2): See information on this data set at NSIDC
To adapt data from a newer source to the data from an older source, the newer data were linearly transformed such that both mean and standard deviation or the newer time series matched the mean and standard deviation of the older time series in the overlap period.
In addition, the data are smoothed by a 5-day running mean. Consequently, the current day and the day before are only averaged over three respectively four days and might still vary slightly for two (resp. one) days
Since July 3, 2012, AMSR2 data is displayed which is adapted with the same parameters as its predecessor AMSR-E. The fit parameters are not deduced by comparing it during an overlap period to another time series. Hence, the data ought to be treated with caution until confirmation by independent sources.
The Arctic ice is even closer to normal. That figure actually includes all northern hemisphere ice.
Very much normal. Remember the 1978 date is the peak high at the end of the 1945-1978 cold.
Reblogged this on Climatism.
Tony, I can’t find the text at the link you provided? What is the precise location?
Try looking here …
http://www.ipcc.ch/publications_and_data/ar4/syr/en/mains3-2-2.html
Thanks!
The missing ice is in…..Virginia!
http://www.delmarvanow.com/story/news/local/virginia/2015/02/19/tangier-island-ice/23668045/
Sea ice in Virginia can’t be normal.
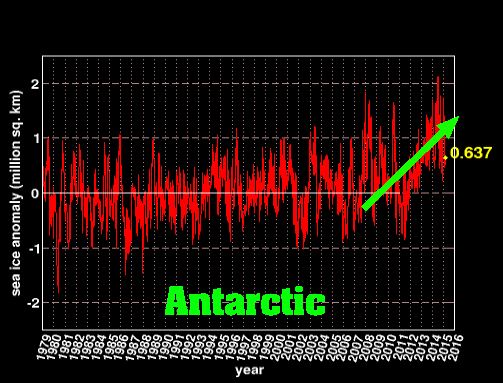
They just deny it all. They pretty much ignore the historic growth in Antarctica and continue to claim the Arctic is losing sea ice “at an unprecedented” rate.