
So far this year, more than 50% of USHCN data is fake, and NCDC is adjusting US temperatures upwards by more than one degree. New records for both.
ftp://ftp.ncdc.noaa.gov/pub/data/ushcn/v2.5/ushcn.tavg.latest.FLs.52i.tar.gz
ftp://ftp.ncdc.noaa.gov/pub/data/ushcn/v2.5/ushcn.tavg.latest.raw.tar.gz

Monthly temperatures which are marked with an “E” are “estimated” rather than measured. More than half of the current data for 2015 is fake.
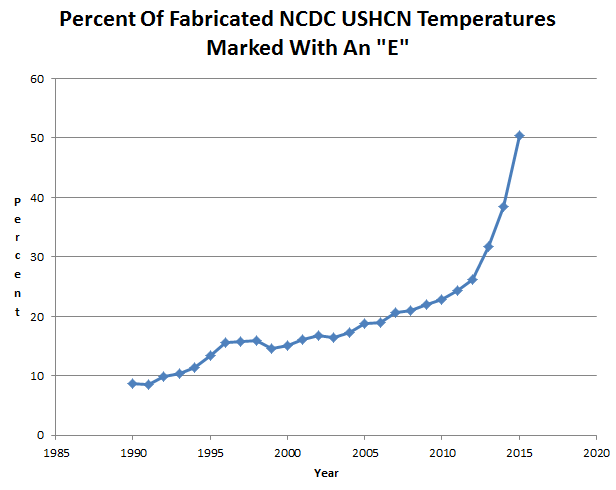
As more data comes in, these numbers will go down some, but the point is that the more data is missing, the higher the temperature. This is likely due to to loss of rural data, and infilling with UHI contaminated urban data.
Zeke and Mosher say this is all good.

Reblogged this on The Grey Enigma and commented:
.
Got science?
What is their hurry? Why not wait for the real data? Oh, silly me I forgot, they don’t even use real data when it is available.
U don’t need data when u know the answer 😉
Is anyone notifying Sen. Inhofe? Isn’t he supposed to be investigating this problem?
The match between the two charts — divergence between final and raw, and percentage of estimated data — is so close that I cannot see how anyone can question the correlation. The more fake data, the greater the divergence. How can anyone not see this?!
The fact that both those charts also have a linear correlation with the amount of CO2 in the air is clear evidence (if not proof beyond a reasonable doubt) that the fakery is being done on purpose and is not just a computer algorithm error.
How does this evolve over time? How many estimated stations for 2010 as reported in 2011, 2012, 2013 etc
That is what the bottom graph shows
Rogue might be after the number of stations that have at least one “E” for each year.
This is amazing! Is this usual? (every winter) we may be truly entering an ice age. The AGw deserves this I hope they all freeze in hell LOL
http://iceagenow.info/2015/02/york-city-surrounded-ice-floes-short-video/
Eliza, as much as despise the deception and the scammers that fund and perpetrate it. I can’t wish for a new round of major glaciation. Such a thing would be damned hard on the human species and many others.
What a hockey stick!
At this rate, by 2020, there will be only one thermometer station left. Bet it will be in LA at the airport there. 🙁
I looked at some data last year and it was the same then, I went back to the Raw and the Real data was there, but not used. But just as bad is the Estimated data is used wholesale instead of historical Raw data and is also used where there is NO DATA.
The excuse for this is to maintian the 1200 odd stations required for USHCN with long timelines, so they use stations with shorter timelines and infill them.
They do not make all the station’s past cooler some actually make very cold records warmer, so that the Trend is Straightened out to better fit The Hockey Stick, The CO2 Trend and to make it easier for the GCM’s to fit to. ie get rid of the warm 30/40s and cold early 1900s & 70s.
The next question is Do the USHCN RAW data or ADJUSTED data get used as GHCN/GISS Raw data?
It must have been too cold to read/fix the rural stations I guess. — John M Reynolds
A sign of desperation. The Cold winter is hurting their cause to convince Americans that they need to be taxed into poverty.
Pl put the name of the perps responsible on each chart showing their “adjustments” and “filll-ins” etc.
The really remarkable thing is that despite all these missing temperatures, they are still able to match USCRN almost exactly.
http://www.ncdc.noaa.gov/temp-and-precip/national-temperature-index/time-series?datasets%5B%5D=uscrn&datasets%5B%5D=cmbushcn¶meter=anom-tmin&time_scale=p12&begyear=2005&endyear=2015&month=12
Two totally different networks (3 if you include ClimDiv), and they all match almost exactly.
Someone is doing some major fudging of data !!!
And its COOLING by about 0.5F per decade.