
Ocean and Ice Services | Danmarks Meteorologiske Institut
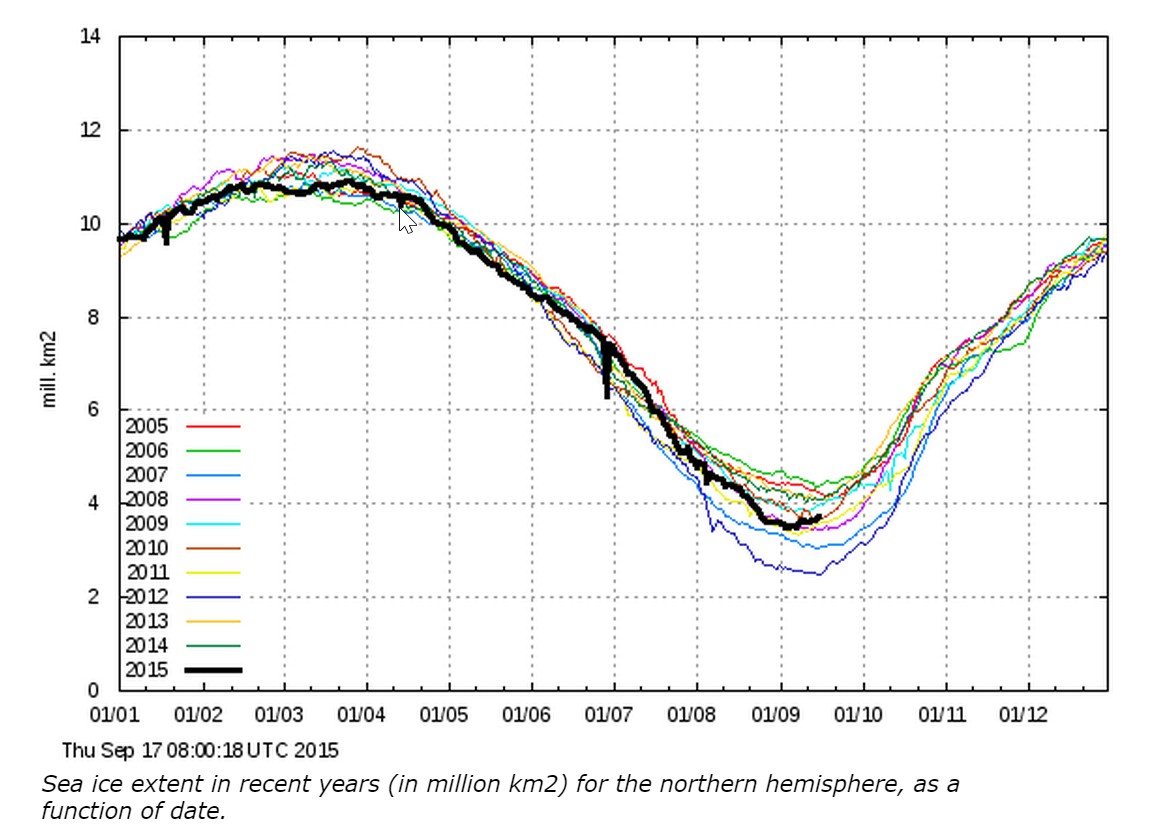
Arctic sea ice extent is normally hitting its low right now, but this year has grown several hundred thousand km² since the beginning of the month. This is due to cold air which has been present since early August.
Government climate experts say it was the hottest summer ever in the Arctic, because they are criminals who are paid to lie about the climate.

Too bad the amount of multiyear ice is plummeting:
http://neven1.typepad.com/.a/6a0133f03a1e37970b01bb0873a8fd970d-pi
Yes we all know multiyear ice melts while the water around it is freezing.
And so now multiyear ice is important to you? I know your hurting after the early minimum but really now, it’s time to just give it up for your own mental health! The Arctic ice extent and your dream of an ice free Arctic is over for the year. So pack it away and don’t start slobbering again until next spring, when, Like a Chicago Cub fan, you can once again hope for your dream to come true.
UHI keeps on melting the Arctic Sea Ice! LOL
It will be truly funny when that black line is above all the other lines, come December.. 🙂
Won’t there be some bleating and carrying-on then !! 🙂
cfgjd,
Even if there is less ice around the edges, PIOMAS shows that the volume of ice is higher than last year, which means the ice at the center is thicker and more solid.
http://psc.apl.washington.edu/wordpress/wp-content/uploads/schweiger/ice_volume/BPIOMASIceVolumeAnomalyCurrentV2.1.png
All that open water around the edges is losing heat to arctic air that is rapidly chilling to ordinary September levels well below the freezing point of salt water. Cold water will mean less melting of the underside of the ice at the middle. That ice in the middle will be at least 3 feet thicker by spring. This well could be how the ice rebuilds, as the cycle changes and the AMO turns cold. Time will tell.
Slush is already forming in the Beaufort Sea:
https://sunriseswansong.wordpress.com/2015/09/13/arctic-sea-ice-the-refreeze/
We’ll see in next months PIOMAS how the late-season melting affected the volume.
“Too bad the amount of multiyear ice is plummeting:”
Not according to PIOMAS.
http://psc.apl.uw.edu/wordpress/wp-content/uploads/schweiger/ice_volume/Bpiomas_plot_daily_heff.2sst.png
Perhaps your credibility would improve if you took your information from real scientific sources rather than crackpot alarmist blogs.
The very first line on your link..
“The lowest point has been reached on all sea ice area and extent graphs, and so the melting season has ended”
So funny ! 🙂 You truly are a low-IQ twerp, cfnt !!
Somehow total heat content is what matters when we talk about the liquid ocean and warming.
When it comes to Polar sea ice however, it’s only the amount of ICE that matters. If it was heat content what would matter is average ice season to season = the integral of the curves.
Why we only talk about points in time and buy into using minimums and maximums for graphs and trends is something I’ve never understood. Even more so considering the number of variables is complex (currents, wind directions, wind magnitudes, air temps, humidity and cloud cover…). In that context mins and maxs are completely irrelevant. It’s like counting the number of named hurricanes rather than measuring ACE.
Further if presumed impact on radiation absorption or albedo is what mattered, you would never compare the minimums, you’d care about the time around the Solstice, and the averages/integrals bracketing that.
Playing the minimum game is almost as bad as accepting CNN as your one-party debate moderator, when the questions and topics frame the story more than the answers.
Can we please stop this and develop/display/adopt more meaningful measures?
You can do whatever you want
IF we could trust data received on water and air temps everywhere all the time you might have a point. But we can’t. Even RSS and UHI have problems at the poles providing reliable data for technical reasons from what I read at Dr. Roy Spencers site. So the only real indicator at the poles that can’t be distorted or fiddled with is the freezing and melting points of water!
Besides, the Arctic sea ice extent, volume, area, etc has been the focus of the alarmists from the beginning. It has been and remains their primary “canary in the coal mine” indicating the planet “has a fever”. Their terms and concepts, not the skeptics. Just as the fantasy of an ice free Arctic with an open NW passage is theirs, not ours.
“Arctic sea ice extent, volume, area, etc has been the focus of the alarmists from the beginning”
“The Beginning” being around the late 1970’s of course.. 😉
“Just as the fantasy of an ice free Arctic with an open NW passage is theirs,”
You mean like when it was navigated in 1903 in a small wooden ship?
What’s the status at the moment? Can even big ice breakers get through ?
Summer above freezing temperatures have been AT or BELOW normal for three of the past six years.
Blue line is freezing, green line is average.
2010 – below average
http://ocean.dmi.dk/arctic/plots/meanTarchive/meanT_2010.png
2011 – average
http://ocean.dmi.dk/arctic/plots/meanTarchive/meanT_2011.png
2012 – average
http://ocean.dmi.dk/arctic/plots/meanTarchive/meanT_2012.png
2013 – below average
http://ocean.dmi.dk/arctic/plots/meanTarchive/meanT_2013.png
2014 – below average
http://ocean.dmi.dk/arctic/plots/meanTarchive/meanT_2014.png
2015 – average
http://ocean.dmi.dk/arctic/plots/meanTarchive/meanT_2015.png
SO WHERE’S THE WARMING!
Some people have a hard time realizing that no matter how jagged the chart gets below the blue line, it is still drastically cold up there. There is no melting of surface ice after that red line drops well below freezing. In fact, the buoy videos show evidence of lots of cloudiness and fresh snow on the ice.
Some people have a hard time realising that during the first 3/4 or so of the Holocene, a sea ice free Arctic was the norm during summer.
The current level is actually anomalously high for the last 10,000 years
The only period there has been much more sea ice than now was during the LIA and the climb out of it.
Ice thickness and volume (not extent which Steve shows)
http://ocean.dmi.dk/arctic/icethickness/anim/plots_uk/CICE_combine_thick_SM_EN_20150916.png
NASA, National Snow and Ice shows “A record extent of first-year ice in the Arctic. Between the 2012 summer minimum and the 2013 winter maximum, sea ice extent increased 11.72 million square kilometers (4.53 million square miles), the largest increase in the satellite record.”
BUT their information STOPS at 2013 so they can show ” how the percentage of ice in each age group has changed from 1983 to 2013.” and then they go to ” estimates [to] show continued thinning”
The recovery can be seen in this chart that goes to 2015.
https://notalotofpeopleknowthat.files.wordpress.com/2015/04/age_coverage_time_series_83_15_w_labels2_thumb.jpg?w=520&h=389
Which is masked by the NASA article (The first one google presents) NEWS: multiyear ice
http://nsidc.org/arcticseaicenews/files/2013/04/Figure52-350×504.png
Little doubt there is more open water in the Arctic this year than last. Negative AO in July and August, plus a major storm in late August caused a loss of ~500k km2 in one week. That will probably be the difference in the end. Increasing and above-average September ice extents signify the coming of the next ice age. Fortunately, that is not the indication this year.
Ice Watch report for Sept. 17: https://rclutz.wordpress.com/2015/09/14/arctic-ice-growing-sept-14/
I’ve been watching the graphs at WUWT’s sea ice page for years. This year I’m not trusting what I’m seeing. The blogger at Sunrise’s Swansong has been showing video from the Arctic buoys, which are supposedly in open water by the NSDIC and Canadian ice graphic displays. They seem to be surrounded by ice, still. How can this be? /sarc.
It turns out that summer melt water sitting on top of the ice may not show up. The radar instrument NSDIC uses can’t see anything smaller than about 15 miles square. I wouldn’t make plans to visit the ice-free Arctic waters based on that display. Think Titanic. The Canadians use another method that sees finer details. However, it has been showing areas along its coast as ice free and the NSDIC display shows the same area frozen. There could be a lot more winter ice to explain away this year.
Meanwhile, I’ll go with the on-the-ground pictures and Tony’s chart.
Those concerns are why I prefer the MASIE ice charts from the Navy people. It is peculiar that recent results from NIC went down and now match NOAA numbers, whereas most of the year NOAA understates by 300-500k km2.
NO, ice at the North Pole has nothing to do with Ice Ages.
Indeed, half of the Arctic Circle, that is, western Alaska and much of eastern Siberia, never glaciated at all during the entire Ice Age which is why animals and humans could easily cross over from the Old World to the New World.
All Ice Ages begin at Hudson Bay. And only Hudson Bay.
Like this perhaps:
http://image.slidesharecdn.com/climatechangespastandfuture-140927073734-phpapp01/95/climate-changes-past-and-future-10-638.jpg?cb=1411803511
As R. A. Cook said,
So the present situation with low Arctic sea ice and high Antarctic sea ice is causing cooling of the planet.
Add in meridonal jets and you get lots of snow leading to increased fall and winter snowfall.
October N.H. Snow Fall
http://www.ncdc.noaa.gov/sotc/service/global/snowcover-nhland/201410.gif
November N.H. Snow Fall
http://www.ncdc.noaa.gov/sotc/service/global/snowcover-nhland/201411.gif
December N.H. Snow Fall
http://www.ncdc.noaa.gov/sotc/service/global/snowcover-nhland/201412.gif
January N.H. Snow Fall
http://www.ncdc.noaa.gov/sotc/service/global/snowcover-nhland/201501.gif
February N.H. Snow Fall
http://www.ncdc.noaa.gov/sotc/service/global/snowcover-nhland/201502.gif
How come you don’t show the spring and summer anomalies, which have been hyooge in Eurasia?
EM, and quite telling that the ice didn’t clear out of the Bay until late August. Hope you can stay warm this winter.
The quote from RA Cook above pertains to the negative feedbacks, sometimes called the Arctic Iris effect. That is: it warms up, ice extent reduces, more heat and vapor escapes, leading to cooling, more snow and increasing ice cover, cutting down the heat loss, and so on. Those are cycles that keep a steady state going, with ups and downs and lags.
An ice age is when those mechanisms are overwhelmed, and the cooling and ice extent both grow, feeding off each other. In that case, it is expected that continental ice sheets will grow slowly and from the North.
The idea that there is a ‘control knob’ when talking of a highly nonlinear, chaotic system is idiotic. When the Milankovitch cycle is in a favorable mode it takes several factors all going in the correct direction to kick the system into the other phase.
A this time the climate seems to be bistable with a warm and a cold state. The cold state seems to be the more stable of the two considering the D/O events.
OK. I didn’t say anything about a control knob. Agree no such thing exists re the climate.
Ron,
I was talking about Al Gore and his clones @ NASA and the CRU and their ‘ CO2 Control Knob’
From the looks of things there are several factors that can kick the climate from the warm state to the cool state.
1. Low solar activity.
2. Volcano
3. Maybe lunar cycles.
4. changes in ocean currents
5. Albedo
6. geomagnetic
A bit on lunar cycles since these are normally completely ignored.
A D/O or Bond cycle is a a 1500 ish year cycle.
https://chiefio.wordpress.com/2013/01/04/lunar-cycles-more-than-one/
https://chiefio.wordpress.com/2014/01/24/the-moons-orbit-is-wrong-it-can-change-a-lot-and-tides-will-too/
https://chiefio.wordpress.com/2012/12/15/d-o-ride-my-see-saw-mr-bond/
https://chiefio.wordpress.com/2014/01/25/a-remarkable-lunar-paper-and-numbers-on-major-standstill/
I think certain government scientists should have to camp out at the North Pole each summer to remind them about the absurdity of ever calling Arctic summer hot. Perhaps a few polar bear encounters would be in order.
Snicker
Maybe those with a bad case of the Bambi Syndrome will do this:
http://a.disquscdn.com/uploads/mediaembed/images/1356/8225/original.jpg
All Ice Ages begin at Hudson Bay….
HMMMmmmm Hudson Bay still had a LOT of ice August 7th 2015
http://iceagenow.info/wp-content/uploads/2015/08/hudson-bay-august-1-2015-587×372.gif
From polar bear science (mid July)
Comparison of 2015 and 2014 on July 14th
https://polarbearscience.files.wordpress.com/2015/07/arctic-sea-ice-canada-2015_2014_14-july.jpg
Well sure there was so much ice as the jet-stream parked where it did…no surprises there.
…some folks call this natural change, and guess what, its real.
No one actually knows where, when, or how, an ice age begins. Seriously, who would believe anyone knows?
It is a matter of looking at the evidence and calculating the odds.
Timing of abrupt climate change: A precise clock</a by Stefan Rahmstorf
One thought is that the moon’s north/south travel make be a cause of D/O and Bond events.
Loutre and Berger, 2003 was based on a computer model and said the Holocene would be a double precession interglacial.
The Holocene interglacial is now 11,717 years old. That’s two centuries or so beyond half the present precession cycle (or 23,000/2=11,500). So the little Ice Age was about the right time for glacial inception. However we had the Modern Grand Solar Minimum – A History of Solar Activity over Millennia
Will the earth descend into glaciation or be a ‘‘double precession cycle’’ interglacial? That is still being argued although the above paper carries a lot of weight. A newer paper from the fall of 2012 Can we predict the duration of an interglacial? agrees as does an older paper from 2007Lesson from the past: present insolation minimum holds potential for glacial inception
Given the age of the Holocene and the low level of solar insolation resulting, the witch hunt against CO2 is really rather humorous.
Very fascinating! I also wonder if the cold North Atlantic is a sign that the Gulf Stream is starting to fail.
The Gulf Stream seems to start in the Antarctic as a cold water current splitting of the Antarctic Circumpolar Current aka the West Wind Drift.. It runs up the side of Africa, warming as it goes and them heading towards the Gulf of Mexico. As the current crosses the equator it turns east and heads for the UK.
http://4.bp.blogspot.com/–OqnJXqNRDA/UsoNC6A19gI/AAAAAAAAMaM/Y1MuWZy3uzE/s1600/FIGURE4A.JPG
The Antarctic Circumpolar Current is a wind driven current so the amount of water forced north as it goes through the constrictions at the Cape of Good Hope and at Drake Passage will be dependent on the strength of the winds.
I go into the solar/ozone/ wind strength connections HERE:
https://stevengoddard.wordpress.com/2015/06/22/global-warming-causes-simultaneous-british-droughts-and-floods/#comment-527180
More on the ocean currents
CHAPTER 31 OCEAN CURRENTS: TYPES AND CAUSES OF CURRENTS (Maritime Safety Information) I start at the beginning of the passage which talks of the southern Atlantic. The chapter also has a map that shows that some of the cold water heads up along the west coast of South America.
Looking at JAXA
https://ads.nipr.ac.jp/vishop/vishop-extent.html?N
start of the month was 4346578 and now it is 4412057, so gain of 65 000 km2, nothing like several hundred thousand km2. Lowest extent was on 14th so it was hitting it’s low about now.
It’s the 3rd lowest extent value in last 10 years and far far below 2006 as we kept hearing until recently on this site…….
As for August being a cold month, according to NSIDC
“Viewed in this framework, the pattern of atmospheric circulation for summer 2015 as a whole (June through August) favored a low September extent. Sea level pressures were higher than average over the central Arctic Ocean, as well as over Greenland and the surrounding region. Pressures were below average over north-central Eurasia. This was associated with air temperatures at the 925 hPa level (about 3,000 feet above the surface) that were above average over much of the Arctic Ocean”
Reality seems to be lacking in this years posts on this site. Previous years posts have been more realistic from the OP.
Andy
“It’s the 3rd lowest extent value in last 10 years ”
But still WAY, WAY ABOVE the zero summer sea ice of the first 3/4 of the Holocene.
The so called “records” start in the coldest period in the last 60 or so years (unadjusted),
But that is the alarmist way, isn’t it.. 😉
Compare everything to the coldest period to show warming.
In fact , we are actually only just above the coldest period in the current interglacial.
THANK GOODNESS FOR WARMING.
There is now less Arctic Sea Ice than in centuries. Why? Little Ice Age does not even begin to explain it…
The Little Ice Age lasted for centuries, and explains it perfectly. CO2 doesn’t begin to explain it.
What an absolute MORON you truly are.
OF COURSE the FACT that we are only slightly above the COLDEST PERIOD in 10,000 years explains the current explains the ANOMALOUSLY HIGH Arctic sea ice.
Of course the small amount of warming we have fortunately had means that some of the sea ice melts.
Gees.. dopey .. wake the **** up !!
Apparently Arctic sea ice reached a summer maximum in the late 1910s, we certainly had one in the late 1970s. It is reasonable to expect Arctic sea ice to slowly build (on balance) into the late 2030s based on this probable ~60 yr cycle. It is debatable how much (if any) relevance Arctic sea ice has in indicating climate change, since some reconstructions of the last glaciation show ice free periods in the Arctic sea. But if it has relevance, and the cycle repeats reliably, we may be able to determine that relevance when we can compare several ~60 yr cycles to determine trend, not before.
Reblogged this on Climatism and commented:
Record growth of Arctic sea ice = record growth of global warming alarmist propaganda.
Repeat:
Record growth of Arctic sea ice = record growth of global warming alarmist propaganda.
Repeat….
The Little Ice Age has been over for well over a century…so stop trying to use it as an explanation for the situation now. We seem to be heading into a Hot Age, do you think it will be called “Little” too in retrospect?
Yet we have still been warming after that LIA, because that LIA was the coldest period in 10,000 years.
We should be extremely thankful fr the small amount of continued warming.
We are NOT heading into a hot age at all, we are still at the very cold end of the Holocene. .. and unfortunately, the slight warming seems to have STOPPED. !
Let’s all hope that it doesn’t decide to drop to the depths of another LIA.. !!!!
I sometimes wonder how alarmists ever get comfortable in their own homes. Most thermostats used in the US are set with a minimum of a 3 degree F comfort zone and many are set at 4-5 deg. F. And yet alarmist write and speak like they believe that the earths flora and fauna can’t stand even 2 degrees of warming.
Or possibly glaciation. The earth is in the right time period of the Milankovitch cycle.
What cfgjd, and the rest never bother to mention, is while the earth has warmed since the depths of the ice age the earth HAS NOT WARMED back to the same warmth as the Medieval Warm Period so the amount of ice in the Arctic has retreated but not fully.
The Titanic sank two hours and 40 minutes after striking an iceberg in 1912 around latitude 41º 46′ north. Hartford, Connecticut is at 41º 76′ N for comparison.
Near the village of Wollaston, archaeologists have found ancient vineyards covering at least 30 acres.
Vikings grew barley on the island of Greenland 1,000 years ago.
You meant to say that we are headed for a recovery, to the temperatures of a “Climate Optimum“.
http://i.snag.gy/BztF1.jpg