I wrote about this before but now I can’t find it… Having trouble using the US*.txt because it wants more than 600mb RAM to do that. State files work fine. I did get it to work once, but I had to kill everything else first. 1GB dell laptop.
Can I make this work on my 6GB windows 64 bit machine? Is there an emulator that works well enough that you can recommend? Thanks.
Posting the command line helps too, just so everyone can replicate easily.
You can install a Linux Virtual machine using either VMware player or Virtual Box
I normally use Cygwin on Windows. This particular graph was generated on my Mac.
Cygwin working great. It didn’t work at first and I didn’t know which items to load, so I loaded everything, 14GB… Running getdaily now, will do that script above next. (cool way to make it all into one file).
Here’s a thought: what if S, the climate sensitivity to increased CO2, is actually negative and the more CO2, the colder Earth gets? I ask all my fellow skeptics, would we change our tune?


I wrote about this before but now I can’t find it… Having trouble using the US*.txt because it wants more than 600mb RAM to do that. State files work fine. I did get it to work once, but I had to kill everything else first. 1GB dell laptop.
Can I make this work on my 6GB windows 64 bit machine? Is there an emulator that works well enough that you can recommend? Thanks.
Posting the command line helps too, just so everyone can replicate easily.
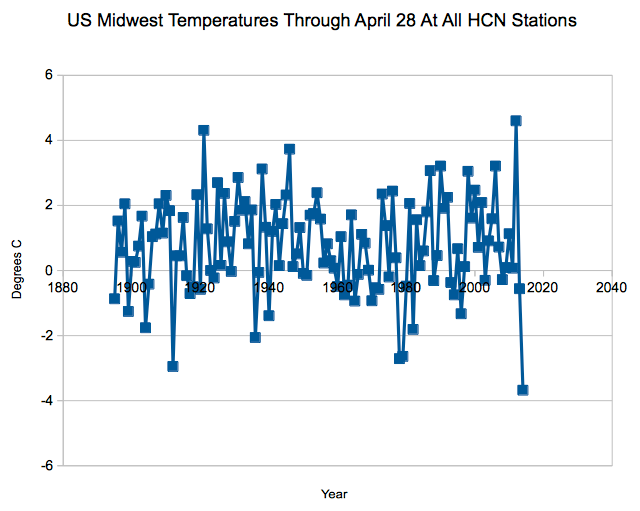
cat MN.txt IA.txt MO.txt IL.txt WI.txt IN.txt MI.txt OH.txt > Midwest.txt
./ghcn.exe Midwest.txt through=0428
You can install a Linux Virtual machine using either VMware player or Virtual Box
I normally use Cygwin on Windows. This particular graph was generated on my Mac.
All are free.
Cygwin working great. It didn’t work at first and I didn’t know which items to load, so I loaded everything, 14GB… Running getdaily now, will do that script above next. (cool way to make it all into one file).
Thanks.
YAY! I was able to replicate your chart here: http://naturalclimate.wordpress.com/2014/05/01/coldeststartofyearever/
Cool stuff. Thanks again.
Here’s a thought: what if S, the climate sensitivity to increased CO2, is actually negative and the more CO2, the colder Earth gets? I ask all my fellow skeptics, would we change our tune?
If the trend over the last two years continues for any length of time, we are all in big trouble whether we change our tune or not!
What if the sensitivity to CO2 was somewhere between zip and insignificant?
My garden (Chicago area) is suffering from lack of warmth. Nothing is germinating.